
A 245-person BeLOVE MRI analysis found that tissue immediately surrounding white matter hyperintensities already carried measurable injury: magnetization transfer saturation was lower inside lesions than contralesional white matter, β = −0.48, p < 0.001, and the gradient extended into normal-appearing tissue around the lesion border. The cognitive signal was narrower but clinically interesting: higher perilesional R1, a quantitative MRI marker sensitive to myelin, water, and iron-related tissue properties, was associated with higher MoCA cognition scores at baseline and at 2-year follow-up.1
Research Highlights
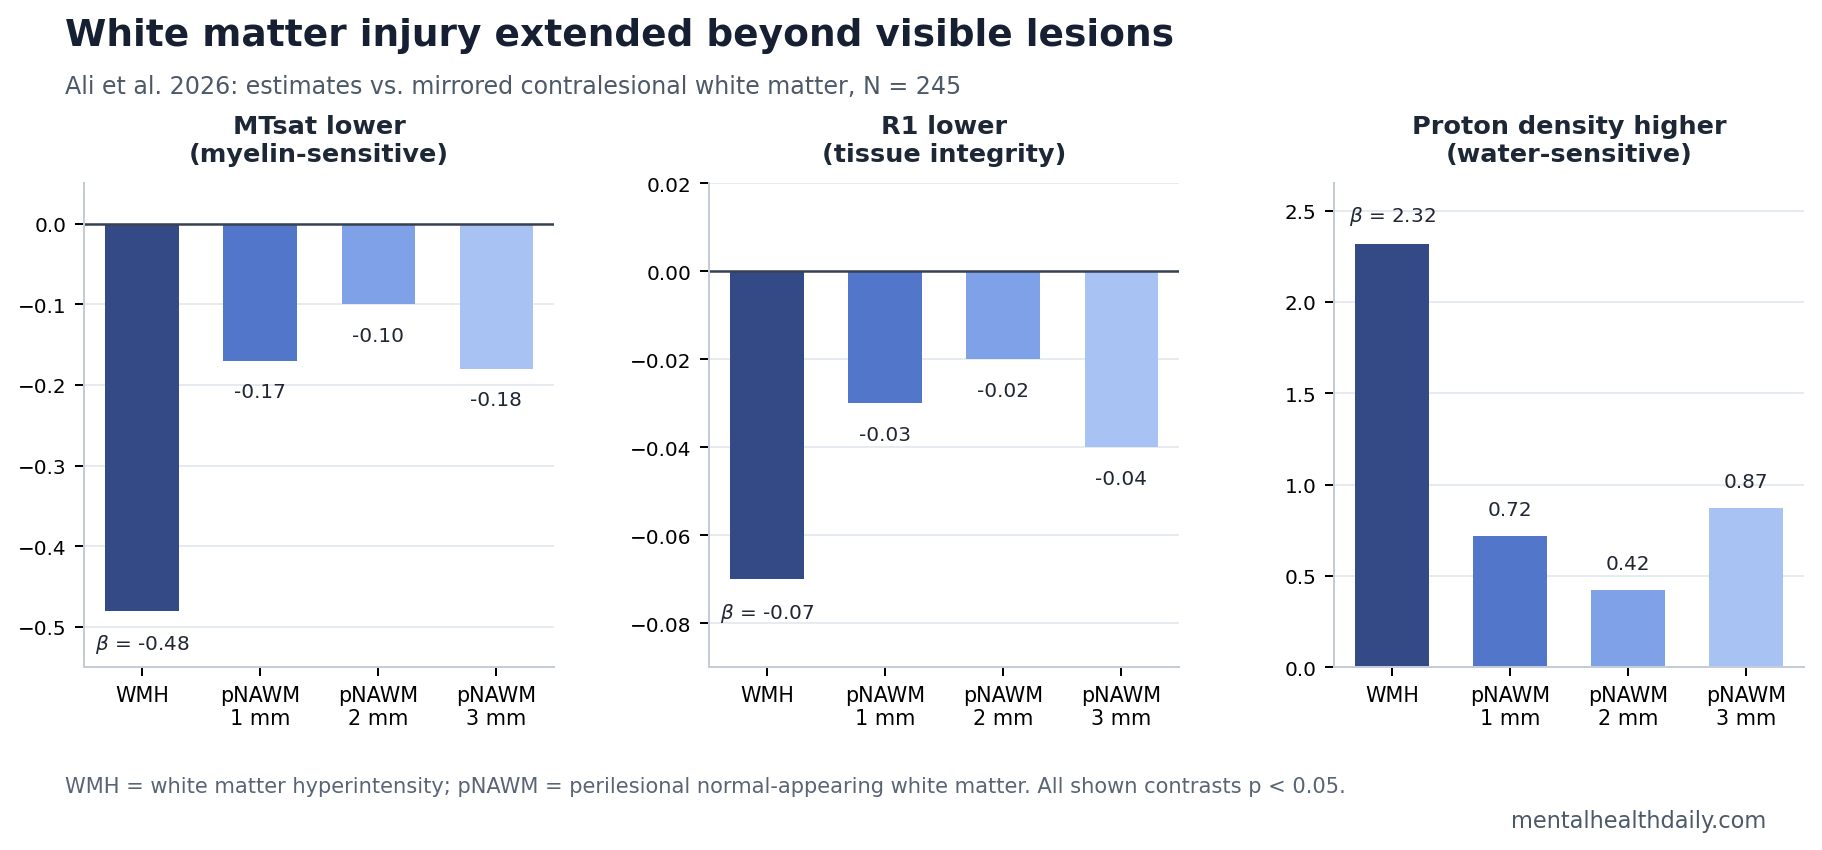
- Lesions had the strongest tissue injury: Compared with mirrored contralesional white matter, white matter hyperintensities had lower MTsat, β = −0.48, lower R1, β = −0.07, and higher proton density, β = 2.32, all p < 0.001.1
- The injury extended beyond visible MRI lesions: At 1 mm from the lesion border, normal-appearing white matter still differed from contralesional white matter for MTsat, β = −0.17, R1, β = −0.03, and proton density, β = 0.72.1
- R1 carried the clearest cognition signal: Higher perilesional R1 was associated with higher MoCA score at baseline, β = 1.457, p = 0.019, and at 2-year follow-up, β = 1.575, p = 0.045.1
- Vascular risk looked more diffuse than focal: Age, waist-hip ratio, BMI, and R-HOMA linked to some tissue metrics, but conventional risk factors did not selectively hit the immediate lesion-border zone across all maps.1
- The evidence is exploratory: The 2026 analysis was a preprint, used cross-sectional imaging, had 121 participants with 2-year MoCA follow-up, and did not adjust p-values for multiple testing.1
White matter hyperintensities are bright spots on brain MRI that often reflect cerebral small vessel disease, the small-blood-vessel injury tied to stroke risk, gait problems, slowed processing speed, and later cognitive decline. They are common in aging brains, but visible lesion volume is a blunt marker: by the time tissue appears bright on conventional FLAIR MRI, some surrounding white matter may already be biologically abnormal.
Quantitative multiparametric mapping (qMPM) is an MRI approach that estimates tissue properties rather than only producing a visual scan. Ali et al. focused on 3 qMPM measures: MTsat (magnetization transfer saturation, sensitive to macromolecules such as myelin), R1 (longitudinal relaxation rate, influenced by myelin, water, and iron-related tissue properties), and proton density (PD, a marker related to water content and tissue density).
245 Vascular-Risk Adults Showed a White Matter Injury Gradient
The BeLOVE analysis included 245 participants with mild to moderate white matter hyperintensity burden. Mean age was 62 years, 29.8% were women, 80.8% had arterial hypertension, 40.0% had diabetes, 55.9% had incident stroke, and median Age-Related White Matter Changes score was 4 on a scale where higher values mean more visible burden.1
The researchers segmented 1 visible white matter hyperintensity region for each participant, mirrored it into the opposite hemisphere as a contralesional comparison region, and then built 1 mm, 2 mm, and 3 mm rings of perilesional normal-appearing white matter. Perilesional means “around the lesion”; normal-appearing means the tissue did not look like a lesion on conventional FLAIR imaging.
That design asked a practical MRI question: does tissue move from damaged to healthier in a graded way as distance from the lesion border increases?
The answer was mostly yes. Lesion cores had the most abnormal qMPM values, immediately adjacent tissue was intermediate, and contralesional white matter looked least affected. MTsat and R1 were lower in lesion tissue, consistent with less intact macromolecular/myelin-related structure. Proton density moved in the opposite direction, consistent with higher water content in damaged tissue.
MTsat and R1 Fell While Proton Density Rose Inside Lesions
Compared with contralesional white matter, white matter hyperintensities showed a large MTsat reduction, β = −0.48 (95% CI −0.52 to −0.44), p < 0.001. R1 was also lower, β = −0.07 (95% CI −0.08 to −0.06), p < 0.001. Proton density was higher, β = 2.32 (95% CI 2.05 to 2.61), p < 0.001.1
Reader translation: the visible lesion carried the expected biological pattern of small-vessel white matter injury: lower myelin-sensitive signal and higher water-sensitive signal.
The surrounding normal-appearing tissue was not clean either. At 1 mm from the lesion, MTsat was still lower than contralesional white matter, β = −0.17, p < 0.001; R1 was lower, β = −0.03, p < 0.001; and proton density was higher, β = 0.72, p < 0.001.1
Spatial pattern: lesion-border tissue looked like an intermediate state, not a binary switch from diseased to healthy. That is the “penumbra” idea: the tissue around a visible lesion may sit on the same injury continuum, even when ordinary MRI still labels it normal.
Prior MRI Studies Already Pointed to a Lesion Penumbra
Ali et al. fit a longer MRI pattern rather than inventing a new one. De Groot et al. reported in 2013 that diffusion changes in normal-appearing white matter preceded later visible white matter lesions, meaning some tissue looked normal before later crossing the imaging threshold into a lesion.2
Maillard et al. described white matter hyperintensities and their surrounding penumbra as a continuum of injury in the aging brain. Their work made the lesion edge clinically important because tissue outside the visible lesion behaved neither fully normal nor fully lesional.3
Van Leijsen et al. later showed that progression of white matter hyperintensities was preceded by heterogeneous decline in microstructural integrity. That finding supports a dynamic view: visible lesion growth may be the endpoint of earlier tissue deterioration, not the starting point.4
Ali et al. added qMPM detail to that line of evidence. Diffusion MRI can detect microstructural disorganization, but qMPM separates tissue contrasts that are more directly interpretable as myelin-sensitive signal, water-sensitive signal, and mixed relaxation properties.
Perilesional R1 Tracked MoCA Cognition at Baseline and 2 Years
Cognition was measured with the Montreal Cognitive Assessment (MoCA), a 30-point screening test where lower scores suggest worse global cognitive performance. The BeLOVE analysis had baseline MoCA data for 173 participants and 2-year follow-up MoCA data for 121 participants.1
Among the 3 qMPM maps, R1 had the clearest cognitive association. Higher mean R1 in perilesional normal-appearing white matter was associated with better baseline MoCA, β = 1.457 (95% CI 0.239 to 2.675), p = 0.019. The follow-up model also linked higher R1 to better 2-year MoCA, β = 1.575 (95% CI 0.037 to 3.113), p = 0.045.1
Spearman correlations told the same directional story but with modest strength: perilesional R1 correlated weakly with baseline MoCA, ρ = 0.16, p = 0.040, and moderately with follow-up MoCA, ρ = 0.34, p < 0.001.1
Calibration: this is not an individual cognitive test. MoCA is broad, follow-up was short, and only 121 participants contributed to the 2-year cognitive model. The useful signal is group-level biological plausibility: subtle tissue integrity around lesions may help explain cognitive variation beyond visible lesion count alone.
That interpretation fits older clinical-risk evidence. Debette and Markus found in a systematic review and meta-analysis that white matter hyperintensities were associated with increased risk of stroke, dementia, and death.5 Brandhofe et al. also linked normal-appearing white matter T2 relaxation time to cognitive status in cerebral small vessel disease, reinforcing the idea that normal-looking tissue can still carry cognitive information.6
Vascular Risk Factors Looked Diffuse, Not Lesion-Edge Specific
The cohort had a heavy vascular-risk profile, so the researchers tested whether age, diabetes, hypertension, obesity markers, arterial stiffness, inflammatory markers, kidney markers, and lipid measures were tied to qMPM tissue values.
Several risk factors linked to MTsat or R1 in selected models. Older age was associated with lower MTsat within lesions, β = −0.015, p < 0.001. Waist-hip ratio, BMI, and R-HOMA, a model-derived insulin-resistance measure, also showed associations with some perilesional MTsat or R1 metrics.1
The more important negative result was spatial. Conventional vascular risk factors did not show strong interactions with distance from the lesion border across the qMPM maps. In plain terms, systemic vascular and metabolic burden seemed to affect white matter broadly rather than selectively damaging the 1 mm rim around an existing lesion.
Clinical implication: lesion-border qMPM may be better understood as a tissue-state marker than as a simple readout of a single risk factor such as hypertension or diabetes. Treating vascular risk still matters, but the scan result does not reduce to “this ring is where hypertension acted.”
What This MRI Result Can and Cannot Support
Supported: qMPM detected a graded tissue-abnormality pattern around visible white matter hyperintensities in a vascular-risk cohort. The lesion core was most abnormal, perilesional normal-appearing white matter was intermediate, and contralesional white matter was least abnormal.
Also supported: perilesional R1 had a modest but consistent association with global cognitive performance at baseline and 2 years. That makes R1 a plausible research biomarker for vascular cognitive impairment, especially when ordinary lesion volume misses tissue-level damage.
Not supported: using qMPM to diagnose dementia, predict an individual person’s cognitive decline, or guide treatment. The study was exploratory, the imaging analysis was mostly cross-sectional, and p-values were not adjusted for multiple testing.
Best next test: longitudinal qMPM should follow whether low-R1 or low-MTsat perilesional tissue later converts into visible white matter hyperintensity and whether changes in those maps predict domain-specific cognition better than WMH volume alone.
Questions About White Matter Hyperintensity Penumbra MRI
What is the white matter hyperintensity penumbra?
It is the tissue surrounding a visible white matter hyperintensity that still looks normal on conventional MRI but may already show microstructural injury on more sensitive imaging. The concept is similar to a border zone: not fully lesion core, not fully healthy tissue.
Why did R1 matter more than MTsat or proton density for cognition?
R1 captures a broader mix of tissue properties, including myelin-related structure, water content, and iron-sensitive effects. In this analysis, R1 may have been the best single summary of perilesional tissue integrity, while MTsat and proton density were clearer for lesion biology than for MoCA variation.
Does this mean white matter hyperintensities cause dementia?
No single MRI lesion causes dementia by itself. White matter hyperintensities are one marker of cerebral small vessel disease, and larger burdens are associated with later cognitive problems. This study supports a subtler point: surrounding tissue injury may help explain why visible lesion burden alone incompletely predicts cognition.
Should patients ask for qMPM MRI?
Not for routine clinical decision-making. qMPM is a research-grade quantitative MRI approach, and this BeLOVE analysis does not establish a clinical threshold. Standard vascular-risk management and ordinary clinical MRI interpretation remain the practical tools for now.
References
- Ali HF, Klammer MG, Leutritz T, et al. Microstructural alterations in white matter hyperintensities and perilesional normal-appearing white matter assessed by quantitative multiparametric mapping – A BeLOVE study. medRxiv. 2026. doi:10.64898/2026.04.10.26350576
- De Groot M, Verhaaren BFJ, De Boer R, et al. Changes in normal-appearing white matter precede development of white matter lesions. Stroke. 2013;44(4):1037-1042. doi:10.1161/STROKEAHA.112.680223
- Maillard P, Fletcher E, Lockhart SN, et al. White matter hyperintensities and their penumbra lie along a continuum of injury in the aging brain. Stroke. 2014;45(6):1721-1726. doi:10.1161/STROKEAHA.113.004084
- Van Leijsen EMC, Bergkamp MI, Van Uden IWM, et al. Progression of white matter hyperintensities preceded by heterogeneous decline of microstructural integrity. Stroke. 2018;49(6):1386-1393. doi:10.1161/STROKEAHA.118.020980
- Debette S, Markus HS. The clinical importance of white matter hyperintensities on brain magnetic resonance imaging: systematic review and meta-analysis. BMJ. 2010;341:c3666. doi:10.1136/bmj.c3666
- Brandhofe A, Stratmann C, Schure JR, et al. T2 relaxation time of the normal-appearing white matter is related to the cognitive status in cerebral small vessel disease. Journal of Cerebral Blood Flow & Metabolism. 2021;41(7):1767-1777. doi:10.1177/0271678X20972511