
A 25-person pilot study of young adults found an ATP fatigue pattern that was directionally reversed from the simple “low brain energy” story: the depression group had higher visual-cortex ATP production metrics than healthy controls, while fatigue severity correlated with ATPase production rate, r = 0.73, p = 0.006.1 The cleaner interpretation is compensatory strain, not a proven energy shortage: resting energy turnover looked elevated, but blood immune cells from participants with depression showed weaker ATP-production reserve than control cells under mitochondrial stress.
Research Highlights
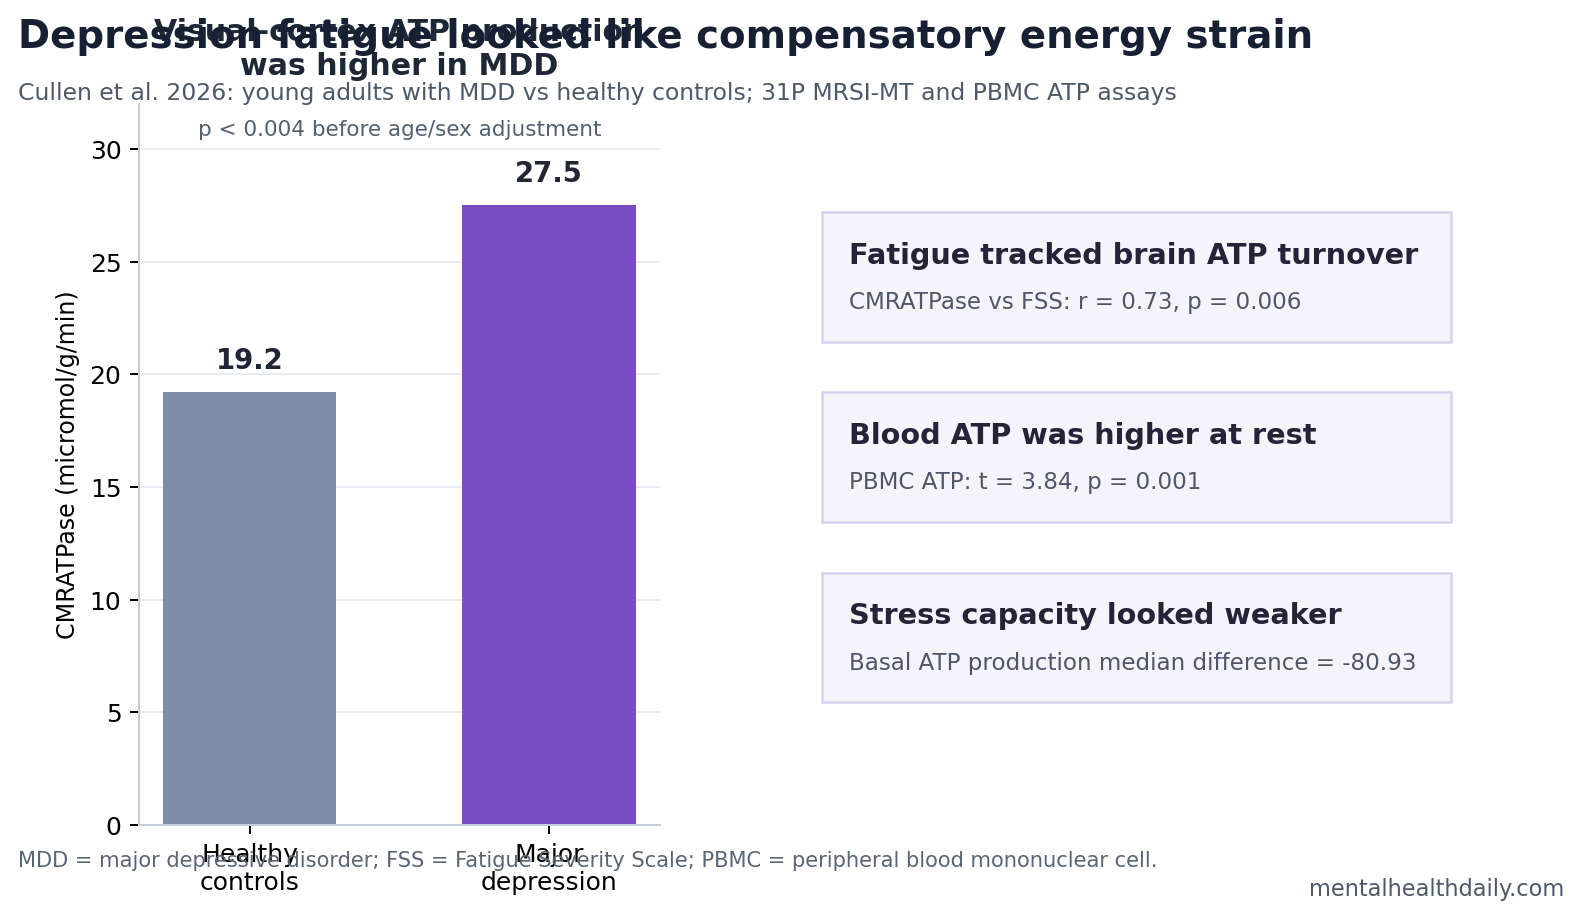
- Brain ATP turnover was higher in depression: Visual-cortex CMRATPase was 27.5 vs. 19.2 μmol/g/min in young adults with major depression vs. healthy controls, p < 0.004 before age/sex adjustment.1
- The primary result weakened after adjustment: CMRATPase moved to trend-level significance after age and sex correction, p = 0.07, and kf,ATPase moved to p = 0.08, so this is a pilot signal rather than a settled biomarker.1
- Fatigue tracked ATPase metrics: Fatigue Severity Scale scores correlated with visual-cortex CMRATPase, r = 0.73, p = 0.006, and with kf,ATPase, r = 0.55, p = 0.02.1
- Blood cells showed the same resting direction: Peripheral blood mononuclear-cell ATP was higher in the depression group, t = 3.84, p = 0.001, and remained significant after age/sex correction, p = 0.004.1
- Reserve under stress looked weaker: In Seahorse metabolic testing, basal ATP production rate was lower in depression than controls, median difference = −80.93, p = 0.027, but that assay result did not survive age/sex correction.1
ATP (adenosine triphosphate) is the cell’s main usable energy currency. The brain spends a large share of the body’s energy budget maintaining ion gradients, membrane function, neurotransmission, and signaling; ATP production is how cells keep those high-cost operations running.
Bioenergetics means the biology of energy production and use. In depression research, the term often gets flattened into a vague “low energy” metaphor. Cullen et al. tested a more specific version: whether young adults with major depressive disorder and fatigue show measurable ATP abnormalities in the living brain and in peripheral blood immune cells.1
25 Young Adults Were Tested With 7T Phosphorus Brain Imaging
The study enrolled young adults aged 18-24 years with and without major depressive disorder. Of 25 participants who completed at least part of both visits, usable 31P MRSI-MT brain imaging data were available for 18 participants, 9 in each group. The blood ATP analysis included 24 participants, 13 healthy controls and 11 with major depression.1
31P MRSI-MT means phosphorus-31 magnetic resonance spectroscopic imaging with magnetization transfer. Instead of only estimating the amount of phosphorus-containing energy metabolites in tissue, the method can estimate ATP production kinetics: how quickly chemical exchange reactions replenish ATP.
The researchers focused on the visual cortex because it was technically accessible to the specialized 7 Tesla surface coil and because prior depression research has increasingly implicated visual-cortex function. That choice matters for interpretation. This was not a whole-brain fatigue map, and it does not show that fatigue lives in visual cortex.
The main imaging measures were:
- kf,ATPase: the forward ATPase reaction rate constant, a kinetic estimate of ATPase-related ATP turnover.
- CMRATPase: the cerebral metabolic rate of ATP production through the ATPase reaction, expressed as μmol/g/min.
- CMRCK: ATP-related energy buffering through the creatine kinase pathway, which did not separate the groups in this pilot.
Higher ATPase Activity Ran Opposite the Simple Deficit Hypothesis
Cullen et al. expected young adults with major depression to show lower ATP production rates in brain and blood. The primary brain finding pointed the other way before covariate adjustment.
Visual-cortex CMRATPase was higher in the depression group than healthy controls, 27.5 vs. 19.2 μmol/g/min, t = 3.35, p < 0.004. The ATPase rate constant was also higher, 0.5 vs. 0.4 sec−1, t = 2.7, p = 0.02.1
The adjustment caveat is not minor. After correcting for age and sex, CMRATPase moved to p = 0.07 and kf,ATPase moved to p = 0.08. That does not erase the directional signal, but it does stop the finding from being treated as a stable group difference.
Calibrated read: the pilot did not confirm a straightforward ATP-production deficit in young adult depression. It found a higher resting ATPase-production signal that may represent compensation, state-related strain, sample imbalance, treatment effects, or a combination of those factors.
Fatigue Severity Tracked Brain and Blood ATP Measures
The fatigue associations made the result harder to dismiss as a random imaging curiosity. Across participants, Fatigue Severity Scale scores correlated with inorganic phosphate, r = 0.53, p = 0.02; kf,ATPase, r = 0.55, p = 0.02; and CMRATPase, r = 0.73, p = 0.006.1
Fatigue Severity Scale (FSS) is a 9-item questionnaire that measures how much fatigue disrupts daily function. In this study, FSS was the clinical variable most directly linked to ATPase production in the visual-cortex measurement.
Peripheral blood told a related but more nuanced story. Peripheral blood mononuclear cells (PBMCs) are immune cells such as lymphocytes and monocytes that can be isolated from blood and tested for cellular metabolism. Resting PBMC ATP was higher in major depression, t = 3.84, p = 0.001, and remained significant after age and sex correction, p = 0.004.1
Blood ATP levels also correlated with fatigue, r = 0.58, p = 0.004, and depression severity measured by the Montgomery-Asberg Depression Rating Scale, r = 0.52, p = 0.01. Visual-cortex CMRATPase correlated with PBMC ATP, r = 0.52, p = 0.033, suggesting that the brain and blood-cell signals were not completely separate systems.1
Blood Cells Looked Less Flexible Under Mitochondrial Stress
The blood-cell stress assay is the part that keeps the paper from becoming a simplistic “depression has more ATP” story. The researchers used a Seahorse metabolic assay, which measures oxygen consumption and acidification while cells are exposed to mitochondrial inhibitors and uncouplers.
Mitochondrial uncoupling means forcing mitochondria to work under a condition where energy demand rises and efficient ATP production is challenged. In healthy reserve capacity, cells should be able to increase oxygen consumption and ATP production when pushed.
In depression, basal ATP production rate was lower in the Seahorse assay, U = 38, median difference = −80.93, p = 0.027. After BAM15-induced uncoupling, oxygen consumption was also lower in the depression group, mean difference = −171.6 plus or minus 97.08, p = 0.045.1
Those Seahorse results did not remain statistically significant after age and sex correction. Even so, they fit the paper’s main biological model better than either a pure excess-energy or pure energy-deficit account: cells may maintain higher resting ATP-related metrics while having less reserve when stressed.
Older Depression Bioenergetics Studies Were Not Asking the Same Question
Earlier phosphorus MRS work in depression usually measured steady-state high-energy phosphate pools, not ATP production kinetics. Moore et al. reported lower basal-ganglia nucleoside triphosphate levels in depressed adults, and Volz et al. reported lower beta-ATP and total ATP in frontal lobe in major depression.2,3
Those older results do not directly contradict Cullen et al. The populations were older, the brain regions differed, magnetic field strength was lower, and the main outcome was metabolite amount rather than ATPase flux. A small 7T kinetic study in 21-year-olds is testing a different biological layer than a 1.5T steady-state ATP study in adults with longer illness histories.
Harper et al. later reported tissue-type-specific bioenergetic abnormalities in adults with major depression, reinforcing the broader point that depression can involve measurable energy-metabolism differences without reducing to one universal ATP direction.4 Karabatsiakis et al. also linked PBMC mitochondrial respiration with depressive subsymptoms and severity, supporting the blood-cell side of the Cullen study’s model.5
A useful comparison comes from outside depression. Zhu et al. used related 7T phosphorus methods in early-stage Parkinson’s disease and found higher visual-cortex CMRATPase in patients than controls.6 Cullen et al. used that parallel cautiously: early disease may involve compensatory ATP-production upregulation before later decompensation.
What This ATP Fatigue Study Can and Cannot Support
Supported: in this pilot, young adults with major depression showed higher visual-cortex ATPase-production metrics before covariate correction, higher resting PBMC ATP after correction, and fatigue-linked correlations across brain and blood ATP measures.
Also supported: the findings ran opposite the researchers’ lower-ATP prediction. The paper is strongest when read as a compensation-and-reserve hypothesis: resting ATP maintenance may be upregulated, while cellular energy flexibility under stress may be weaker.
Not supported: diagnosing depression from ATP, diagnosing fatigue from a blood test, localizing fatigue to visual cortex, or claiming that ATP supplements would treat major depression. The design was cross-sectional, the sample was small, comorbidity was common, and treatment exposure was not experimentally controlled.
Best next test: a larger longitudinal study should measure ATP kinetics across multiple brain regions, balance sex and treatment status, include medication-naive and treated groups, and test whether fatigue changes track ATPase flux over time or after treatment.
Questions About Depression Fatigue and ATP
Does this mean depressed people have too much brain energy?
No. Higher ATPase production metrics do not mean the brain has excess usable energy. A more plausible interpretation is higher turnover or compensation: cells may work harder to maintain baseline energy stability.
Why did the researchers study visual cortex?
The visual cortex was technically favorable for the 7T phosphorus surface coil, and visual-cortex changes have appeared in some depression research. The result should be treated as an accessible brain-energy measurement, not as proof that fatigue originates in visual cortex.
Could a blood ATP test diagnose depression fatigue?
No. PBMC ATP was higher in the depression group and correlated with fatigue in this small study, but no clinical threshold was validated. The blood data are useful for mechanism research, not individual diagnosis.
Do ATP supplements or mitochondrial treatments follow from this?
Not yet. The study suggests ATP bioenergetics may be relevant to fatigue in major depression, but it does not test any treatment. A treatment claim would need randomized trials measuring symptoms and ATP-related mechanisms together.
References
- Cullen KR, Tye SJ, Klimes-Dougan B, et al. ATP bioenergetics and fatigue in young adults with and without major depression. Translational Psychiatry. 2026. doi:10.1038/s41398-026-03904-y
- Moore CM, Christensen JD, Lafer B, Fava M, Renshaw PF. Lower levels of nucleoside triphosphate in the basal ganglia of depressed subjects: a phosphorous-31 magnetic resonance spectroscopy study. American Journal of Psychiatry. 1997;154(1):116-118. PubMed
- Volz HP, Rzanny R, Riehemann S, May S, Hegewald H, Preussler B, et al. 31P magnetic resonance spectroscopy in the frontal lobe of major depressed patients. European Archives of Psychiatry and Clinical Neuroscience. 1998;248(6):289-295. PubMed
- Harper DG, Jensen JE, Ravichandran C, Perlis RH, Fava M, Renshaw PF, et al. Tissue type-specific bioenergetic abnormalities in adults with major depression. Neuropsychopharmacology. 2017;42(4):876-885. doi:10.1038/npp.2016.180
- Karabatsiakis A, Bock C, Salinas-Manrique J, Kolassa S, Calzia E, Dietrich DE, et al. Mitochondrial respiration in peripheral blood mononuclear cells correlates with depressive subsymptoms and severity of major depression. Translational Psychiatry. 2014;4:e397. doi:10.1038/tp.2014.44
- Zhu XH, Lee BY, Tuite P, Coles L, Sathe AG, Chen C, et al. Quantitative assessment of occipital metabolic and energetic changes in Parkinson’s patients, using in vivo 31P MRS-based metabolic imaging at 7T. Metabolites. 2021;11. PubMed