A 2026 NHANES mortality analysis found that adults with PHQ-9 depressive symptoms had lower long-term all-cause mortality when their CALLY index was higher: in the fully adjusted model, each 1-unit higher log-CALLY value carried a hazard ratio of 0.59, with a 95% confidence interval from 0.51 to 0.68.1 The useful interpretation is prognostic, not therapeutic: CALLY may flag inflammation, nutrition, immune status, and comorbidity burden in people screening positive for depressive symptoms.
Research Highlights
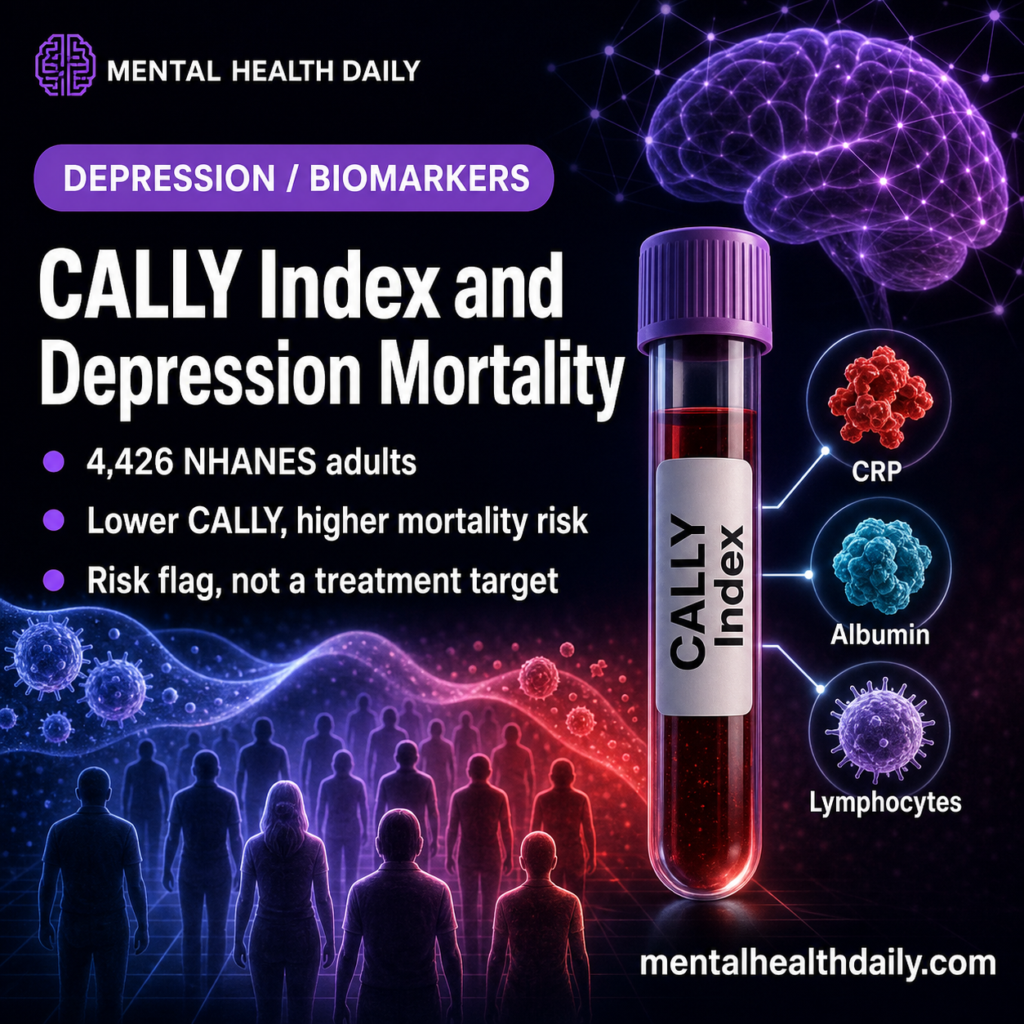
- Higher CALLY predicted lower mortality: among 4,426 NHANES adults with PHQ-9 scores of 5 or higher, each 1-unit higher log-CALLY value was associated with lower all-cause mortality in the fully adjusted model: HR 0.59, 95% CI 0.51 to 0.68.1
- Risk fell nonlinearly: restricted cubic spline modeling found an L-shaped association with a turning point at log-CALLY 4.09; below that threshold, each 1-unit increase carried HR 0.39, 95% CI 0.29 to 0.53.1
- The sample was symptom-defined: depression meant PHQ-9 score ≥ 5, so the analysis included mild depressive symptoms rather than only diagnosed major depressive disorder.1
- Adjacent NHANES work points the same direction: 2025 analyses of PINI and PNI in depressive-symptom populations also linked poorer immune-nutrition status to higher mortality risk.2,4
- CALLY is not depression-specific: the index combines CRP, albumin, and lymphocyte count, so it may be capturing systemic illness and frailty more than a mood-specific biology signal.5,6
CALLY stands for C-reactive protein-albumin-lymphocyte index. In plain language, it combines 3 routine blood signals: C-reactive protein (CRP; a marker of systemic inflammation), albumin (a blood protein tied to nutrition, liver function, and illness burden), and lymphocyte count (a rough immune-cell signal). The formula is lymphocyte count multiplied by albumin, divided by CRP, then scaled by 103.
What a low value can mean: higher inflammation, lower albumin, lower lymphocytes, or some combination. That makes CALLY biologically plausible as a mortality-risk marker, but also easy to overread.
A low value does not tell a reader which pathway is driving risk, and it does not prove that changing the index itself would change survival.
4,426 NHANES Adults With Depressive Symptoms Were Followed for 121 Months
Zhang et al. used US National Health and Nutrition Examination Survey data from 2005-2010 and 2015-2016, then linked participants to National Death Index mortality data through December 31, 2019.1 The final analytic sample included 4,426 adults whose Patient Health Questionnaire-9 (PHQ-9) score was at least 5.
PHQ-9 is a 9-item depression-symptom questionnaire. A score of 5 usually means mild depressive symptoms, not necessarily major depressive disorder. That distinction changes the clinical reading: this is a general depressive-symptom risk-stratification study, not a survival study limited to specialty-clinic depression patients.
- Follow-up: median 121 months.
- Deaths: 657 all-cause deaths.
- Mortality rate: 14.84% over follow-up.
- Baseline pattern: participants who died were older, more often male, more often smokers, and had more cardiovascular disease.
Those baseline differences are not side details. Age, smoking, diabetes, poverty, chronic disease, inflammation, nutrition, and mortality are tied together tightly enough that any biomarker-survival association needs cautious language even after statistical adjustment.
Higher CALLY Values Tracked Lower All-Cause Mortality
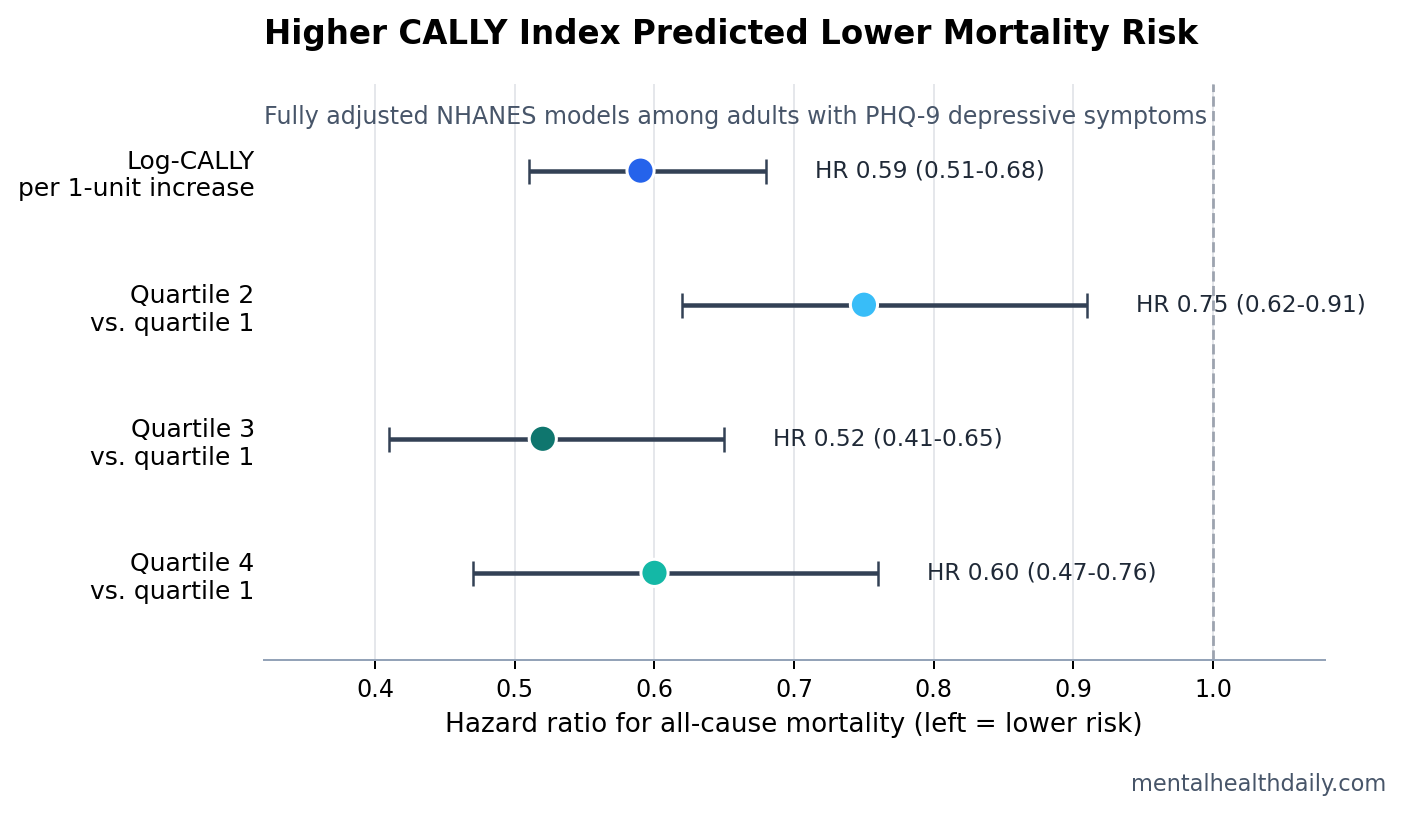
The main Cox proportional-hazards model treated natural-log-transformed CALLY as a continuous predictor. In the fully adjusted model, each 1-unit higher log-CALLY value was associated with lower all-cause mortality: HR 0.59, 95% CI 0.51 to 0.68, p < 0.0001.1 A hazard ratio below 1 means the higher-CALLY group had lower modeled mortality risk over time.
Quartile models told a similar story, though not as a perfectly stepwise dose response. Compared with the lowest CALLY quartile, quartile 2 had HR 0.75, quartile 3 had HR 0.52, and quartile 4 had HR 0.60. Trend across quartiles remained statistically strong at p < 0.0001.
The nonlinearity is important. Restricted cubic spline modeling found an L-shaped association with a turning point at log-CALLY 4.09, with a 95% confidence interval from 3.85 to 4.26. Below 4.09, higher CALLY was more strongly associated with lower mortality: HR 0.39 per 1-unit increase. At or above 4.09, the association was weaker but still statistically significant: HR 0.76.1
CALLY Looks Like a General Health Signal, Not a Depression-Specific Mechanism
The index is attractive because it is cheap and biologically broad. CRP tends to rise with systemic inflammation. Albumin can fall with malnutrition, liver disease, kidney disease, inflammation, and severe illness. Lymphocyte count can reflect immune reserve, stress physiology, infection, medication effects, or chronic disease.
That breadth is also the limitation. A low CALLY value in an adult with depressive symptoms might point toward several overlapping risk pathways:
- Inflammatory burden: CRP contributes directly to the denominator, so higher CRP lowers the index.
- Nutritional or illness burden: lower albumin can mark poorer protein status or chronic disease severity.
- Immune vulnerability: lower lymphocyte count may reflect immune suppression or systemic stress.
- Comorbidity clustering: smoking, diabetes, chronic respiratory disease, cardiovascular disease, and poverty can all move both biomarkers and mortality risk.
Depression research already supports part of that biology. Osimo et al. reported higher inflammatory markers in major depressive disorder, including CRP, across meta-analytic evidence.5 Lawes et al. connected depressive symptoms and systemic inflammation to mortality risk, which fits the idea that inflammation can help identify a higher-risk depressive-symptom subgroup.3
Other Immune-Nutrition Index Studies Point in the Same Direction
Zhang et al. are not alone in using composite blood indexes to stratify mortality risk in depressive-symptom populations. Fang et al. studied a prognostic immune and nutritional index in NHANES adults with depression and similarly reported that poorer immune-nutrition status was associated with higher all-cause and cause-specific mortality.2 Ding and Zou analyzed the prognostic nutritional index and found another mortality-linked nutrition-immune signal in adults with depression.4
Pattern across indexes: the exact formula changes, but the general story is stable. When depressive symptoms travel with systemic inflammation, low protein/nutrition markers, and poorer immune status, mortality risk looks higher.
What remains unsettled: whether these indexes add enough predictive value beyond age, smoking, diabetes, cardiovascular disease, poverty, frailty, and standard lab panels to change clinical workflow. A statistically significant hazard ratio is not the same as a deployable screening tool.
The Subgroup Findings Are Hypothesis-Generating
Zhang et al. reported statistically significant interactions for poverty income ratio, diabetes, smoking, and chronic respiratory disease.1 The PHQ-9 severity split was more reassuring: the CALLY association looked similar in mild symptoms and moderate-to-severe symptoms, with HR 0.61 for PHQ-9 scores 5-9 and HR 0.59 for scores of 10 or higher; the severity interaction p-value was 0.829.
Those subgroup results should not be treated as patient-level rules. They are useful because they identify where the signal may be strongest, but they sit inside an observational analysis with many correlated health risks.
For a smoker with diabetes and depressive symptoms, low CALLY may be a serious risk flag. It still cannot say whether inflammation, nutrition, immune status, vascular disease, smoking history, medication burden, or unmeasured frailty is the main driver.
The Clinical Use Is Risk Flagging, Not CALLY-Targeted Treatment
An evidence-strength note is necessary here: this was an observational mortality analysis. It can support prediction and risk stratification, but it cannot prove that raising CALLY lowers mortality. One baseline blood draw also cannot show whether improving albumin, lowering CRP, or changing lymphocyte count changes later risk.
The most defensible clinical interpretation is narrow:
- Low CALLY may identify higher-risk adults with depressive symptoms. The mortality association was large enough to deserve attention.
- The index should trigger assessment, not a single biomarker target. Inflammation, nutrition, smoking, diabetes, chronic respiratory disease, cardiovascular disease, medication burden, and social risk all need ordinary clinical scrutiny.
- Depression severity alone is not the full risk story. PHQ-9 symptom level did not materially change the CALLY association, which argues for broader medical risk assessment in depressive-symptom populations.
The CALLY index may eventually become part of a cheap risk-screening layer, especially in settings where routine labs are already available. For now, it is better read as a composite warning light than as a treatment target.
Questions About CALLY Index and Depression Mortality
Does a low CALLY index mean depression is causing higher mortality?
No. The study included adults with PHQ-9 depressive symptoms and found an association between lower CALLY and higher mortality risk. It did not show that depression caused the biomarker pattern or that the biomarker pattern caused death.
Is CALLY a depression test?
No. CALLY combines CRP, albumin, and lymphocyte count. It is better understood as a systemic health, inflammation, nutrition, and immune-status index that may be relevant in people with depressive symptoms.
Should clinicians try to raise CALLY directly?
Not from this evidence alone. A low value should prompt a search for ordinary drivers of risk: inflammation, infection, poor nutrition, liver or kidney disease, cardiometabolic disease, smoking, chronic respiratory disease, and social disadvantage.
Why did quartile 4 not look better than quartile 3?
The association was nonlinear rather than perfectly dose-graded. Both quartile 3 and quartile 4 had lower mortality risk than quartile 1, and the spline model suggested the strongest risk change occurred below the log-CALLY threshold of 4.09.
References
- Zhang Y, et al. The impact of the CALLY index on all-cause mortality in patients with depression: a longitudinal analysis using NHANES data. Health Science Reports. 2026. https://doi.org/10.1002/hsr2.72387
- Fang et al. Prognostic immune and nutritional index and mortality in NHANES adults with depression. Frontiers in Nutrition. 2025. https://doi.org/10.3389/fnut.2025.1588896
- Lawes H, et al. Depressive symptoms, systemic inflammation, and mortality risk. Psychological Medicine. 2019. https://doi.org/10.1017/S003329171800209X
- Ding and Zou. Prognostic nutritional index and all-cause and cardiovascular mortality in adults with depression. Frontiers in Nutrition. 2025. https://doi.org/10.3389/fnut.2025.1599830
- Osimo EF, et al. Inflammatory markers in depression: a meta-analysis. Brain, Behavior, and Immunity. 2020. https://doi.org/10.1016/j.bbi.2020.02.010
- Han et al. CALLY index and all-cause and cardiovascular mortality in cardiovascular disease. BMC Cardiovascular Disorders. 2025. https://doi.org/10.1186/s12872-025-04596-w