A 166-child resting-state fMRI study found that clinician-observed autism severity, not ADHD severity, tracked connectivity strength between a left middle frontal gyrus node and the posterior cingulate/default mode network across children diagnosed with autism or ADHD without autism. The result is transdiagnostic, but asymmetrical: autism traits carried the connectome signal after ADHD ratings were controlled.1
Research Highlights
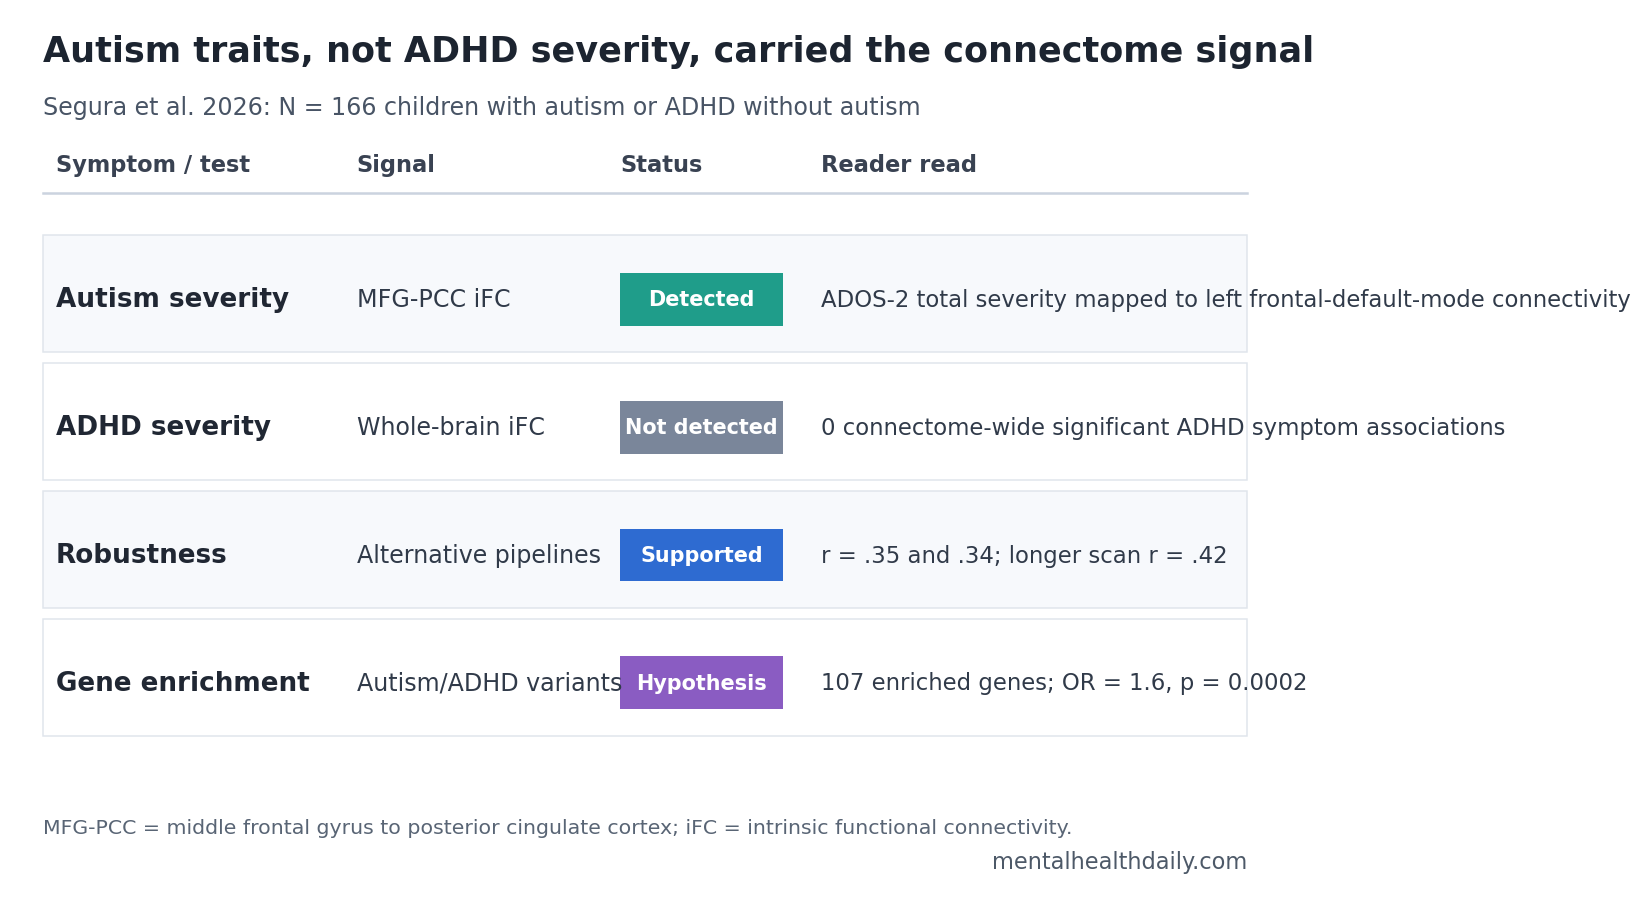
- Autism severity carried the signal: In 166 verbal children aged 6-12 years, ADOS-2 calibrated autism severity tracked middle frontal gyrus-posterior cingulate connectivity across autism and ADHD diagnoses.1
- ADHD severity did not map cleanly: Whole-brain analyses found 0 connectome-wide significant associations for ADHD total, inattentive, or hyperactive/impulsive symptom ratings after covariate adjustment.1
- Autistic traits were common in ADHD: 38 of 103 children diagnosed with ADHD without autism met or exceeded the ADOS-2 autism-spectrum cutoff, despite not receiving an autism diagnosis.1
- The imaging result survived robustness checks: The MFG-PCC connectivity association held under 2 alternative denoising pipelines, r = .35 and r = .34, and under longer scan data, r = .42.1
- Gene-expression analysis pointed to shared biology: The connectivity map decoded 1519 genes and enriched 107 rare-variant autism/ADHD genes, OR = 1.6, p = 0.0002.1
Intrinsic functional connectivity (iFC) means the degree to which brain regions’ activity rises and falls together while a person is resting. Connectome-based symptom mapping uses those whole-brain connectivity patterns to ask whether symptom severity and diagnostic label separate into different circuit patterns.
Segura et al. used that approach to test a question that ordinary autism-vs.-ADHD comparisons often blur: when children show overlapping neurodevelopmental symptoms, which symptom dimension is actually tied to the brain connectivity result?
166 Children With Autism or ADHD Passed Low-Motion MRI Quality Checks
The analyzed sample included 63 children with autism and 103 children with ADHD without autism. All were verbal, aged 6-12 years, had full-scale IQ above 65, and completed at least 1 structural MRI scan plus 1 resting-state fMRI scan that passed quality control.1
MRI motion control was not a footnote. Of 194 children who otherwise met inclusion criteria and completed MRI, 28 were excluded because imaging quality did not pass the study threshold. Resting-state fMRI is especially vulnerable to head movement, and movement can mimic or hide connectivity effects in children.
Autism symptoms were indexed with ADOS-2 calibrated severity scores. The Autism Diagnostic Observation Schedule, Second Edition, is a structured clinician-observation assessment; calibrated severity scores attempt to put observed autism severity on a comparable scale across modules and age/language levels.
ADHD symptoms were indexed with clinician ratings derived from K-SADS parent interviews. The Kiddie Schedule for Affective Disorders and Schizophrenia is a semi-structured psychiatric interview; in this study, it supplied inattentive, hyperactive/impulsive, and total ADHD severity scores.
The overlap was substantial. In the autism group, 53 of 63 children, 84%, had comorbid ADHD. In the ADHD-without-autism group, 38 of 103 children, 37%, reached the ADOS-2 autism-spectrum cutoff of CSS-Total = 4 despite not meeting DSM-5 autism criteria by clinician best estimate.1
Frontal-DMN Connectivity Rose With Autism Severity Across Diagnoses
The primary whole-brain analysis used multivariate distance matrix regression (MDMR), a connectome-wide method that tests whether full-brain connectivity profiles differ as a behavioral score changes. Instead of asking only whether 1 connection is associated with a symptom score, MDMR first identifies brain regions whose whole connectivity pattern varies with that score.
ADOS-2 total severity identified 2 left-hemisphere nodes: the middle frontal gyrus within the frontoparietal network and the posterior cingulate/precuneus within the default mode network. The frontoparietal network supports cognitive control and flexible task demands. The default mode network is a set of regions active during internally directed thought, self-referential processing, memory, and social-cognitive inference.
Follow-up seed-based connectivity analysis found that stronger connectivity between the middle frontal gyrus and posterior cingulate was associated with more severe autism symptoms after controlling for ADHD severity, age, sex, and median framewise displacement.1
The social-affect component, not restricted/repetitive behavior, carried the clearer local correlation inside that MFG-PCC connection. Social-affect severity correlated with the connection at r(164) = .23, p = 0.003; restricted/repetitive behavior did not, r(164) = .08, p = 0.290.1
ADHD Symptom Severity Had No Connectome-Wide Signal
The ADHD finding is the calibration point. Segura et al. did not find statistically significant connectome-wide associations for ADHD total severity, inattention, or hyperactivity/impulsivity, whether those ratings came from clinician-parent interview or parent questionnaire measures.1
That does not prove ADHD has no connectivity biology. It means this study’s symptom measure, sample range, and imaging design did not detect an ADHD-specific brain-behavior map after autism severity and nuisance covariates were included.
Measurement asymmetry is one likely reason. Autism severity used direct clinician observation through ADOS-2. ADHD severity relied on parent-interview ratings because psychiatry lacks a standardized observational ADHD instrument equivalent to ADOS-2. The researchers explicitly argued that better observational ADHD measures may be needed to detect brain-behavior associations.
Severity range also matters. Both diagnostic groups had clinically elevated ADHD symptoms, so ADHD scores may not have varied enough to expose a robust connectivity gradient. A narrow clinical range can make a real association look absent.
Lake et al. previously showed that individual functional brain organization could predict social ability across autism and ADHD samples, while Choi et al. reported cross-diagnostic resting-state network features in neurodevelopmental disorders.2,3 Segura et al. sharpened that line of evidence by asking which symptom domain was doing the work after both autism and ADHD symptoms were modeled together.
High Autistic Traits Split the Sample Better Than Diagnosis Alone
Researchers also grouped children by autistic-trait level regardless of primary diagnosis. The high autistic-traits subgroup included 92 children at or above the ADOS-2 cutoff; the low subgroup included 74 children below it.1
The high-trait group was mixed diagnostically: 54 children with autism and 38 children with ADHD without autism. The low-trait group also crossed diagnostic labels, though it was mostly ADHD without autism: 9 autism and 65 ADHD-without-autism children.
Connectivity tracked trait level: mean MFG-PCC iFC was 0.13 in the high autistic-traits group vs. 0.001 in the low group, FDR p = 0.003. ADHD severity did not differ significantly between the high- and low-trait groups, which helps separate the autism-trait signal from general ADHD burden.1
Adaptive functioning was lower: the high-trait group showed weaker Vineland socialization, daily living, and adaptive behavior composite scores. That pattern fits clinical work showing that autistic traits inside ADHD samples can mark practical impairment even when the formal autism diagnosis is not assigned.1
Gene Enrichment Was Hypothesis-Generating, Not a Blood Test
The study then used an in silico gene-expression analysis. In silico means computational rather than directly measured in the children’s tissue. The researchers projected the connectivity map onto the Allen human brain gene-expression atlas, then asked whether the resulting gene-expression pattern was enriched for genes previously implicated in autism and ADHD.
The MFG connectivity map decoded 1519 genes. Of those, 107 overlapped with a 1046-gene list from Satterstrom et al., a rare-variant study reporting a similar burden of protein-truncating variants in autism and ADHD. The overlap was statistically enriched: OR = 1.6, p = 0.0002.1,4
Gene-ontology terms pointed toward neuron projection and morphogenesis processes, including axonogenesis. Axonogenesis is the developmental process by which neurons grow axons, the long projections that carry signals to other cells. The result gives a plausible developmental biology bridge from genes to macro-scale connectivity, but it does not show that any individual child has a clinically useful genetic marker.
Default-mode-network reviews and autism network studies make the same broad direction plausible: altered integration and segregation of the default mode network has been reported in autism and ADHD literature, with autism studies repeatedly linking default-mode organization to social communication.5,6
What This Connectome Study Can and Cannot Support
Supported: in this carefully phenotyped sample, clinician-observed autism severity aligned with a frontoparietal-default-mode connectivity pattern across children diagnosed with autism or ADHD without autism.
Also supported: autistic traits in ADHD samples can carry clinical information. In this study, 37% of children diagnosed with ADHD without autism crossed the ADOS-2 autism-spectrum cutoff, and high autistic traits were tied to weaker adaptive functioning.
Not supported: using the connectivity result as an individual diagnostic classifier. A group-level fMRI association does not diagnose autism, separate autism from ADHD in a clinic, or decide treatment for a child.
Design limits: the analysis was cross-sectional, moderately sized for brain-wide association work, mostly male, restricted to verbal school-aged children, and limited by ADHD measurement tools. Marek et al. warned that reproducible brain-wide associations often require thousands of participants; Segura et al. partly addressed reproducibility with robustness checks, but replication remains necessary.7
Clinical Read: Measure Autistic Traits Inside ADHD, Do Not Chase a Scan
The practical value is not ordering fMRI for ADHD. It is measuring the symptom domain that changes interpretation. A child can have ADHD as the primary diagnosis and still show autism-like social-communication patterns that predict adaptive difficulty, school friction, family stress, and service needs.
For an ADHD evaluation, this argues for asking concrete autism-trait questions rather than assuming hyperactivity or inattention explains every social problem:
- Social reciprocity: whether conversation, peer play, and social repair break down in ways not explained by impulsivity alone.
- Restricted or repetitive patterns: whether interests, routines, sensory preferences, or repetitive behaviors shape daily functioning.
- Adaptive skills: whether communication, socialization, and daily living skills lag behind cognitive ability or symptom-control expectations.
Segura et al. add a biological reason to take those questions seriously. The autism-trait dimension, not the categorical label by itself, was the part of the phenotype that aligned with the strongest connectivity result.
Questions About Autism-ADHD Connectome Mapping
Did the study show that autism and ADHD are the same condition?
No. The study showed overlap in symptoms and biology, but the detected brain-behavior signal was stronger for autism severity than for ADHD severity.1
Was ADHD ignored in the analysis?
No. ADHD ratings were included in the primary models, and autism-severity associations were tested while controlling for ADHD severity.
Separate ADHD total, inattentive, and hyperactive/impulsive analyses did not produce connectome-wide significant results.1
Could this become a diagnostic brain scan?
Not from this evidence. The result is a group-level research association in 166 children, not an individual diagnostic tool.
Why use ADOS-2 instead of only parent questionnaires?
ADOS-2 is based on clinician observation, and in this study the ADOS-2 signal was more robust than parent autism scales for the connectivity association.
What should clinicians or parents take from the ADHD subgroup result?
Children diagnosed with ADHD can still have meaningful autistic traits. Those traits should be assessed directly when social communication, routines, sensory patterns, or adaptive skills look more affected than ADHD alone would predict.
References
- Segura P, Pagani M, Bishop SL, et al. Connectome-based symptom mapping and in silico related gene expression in children with autism and/or attention-deficit/hyperactivity disorder. Molecular Psychiatry. 2026;31:282-295. doi:10.1038/s41380-025-03205-8
- Choi EJ, Vandewouw MM, Taylor MJ, et al. Beyond diagnosis: cross-diagnostic features in canonical resting-state networks in children with neurodevelopmental disorders. NeuroImage: Clinical. 2020;28:102476. doi:10.1016/j.nicl.2020.102476
- Lake EMR, Finn ES, Noble SM, et al. The functional brain organization of an individual allows prediction of measures of social abilities transdiagnostically in autism and attention-deficit/hyperactivity disorder. Biological Psychiatry. 2019;86:315-326. doi:10.1016/j.biopsych.2019.02.019
- Satterstrom FK, Walters RK, Singh T, et al. Autism spectrum disorder and attention deficit hyperactivity disorder have a similar burden of rare protein-truncating variants. Nature Neuroscience. 2019;22:1961-1965. doi:10.1038/s41593-019-0527-8
- Harikumar A, Evans DW, Dougherty CC, Carpenter KLH, Michael AM. A review of the default mode network in autism spectrum disorders and attention deficit hyperactivity disorder. Brain Connectivity. 2021;11:253-263. PubMed
- Yerys BE, Gordon EM, Abrams DN, et al. Default mode network segregation and social deficits in autism spectrum disorder: evidence from non-medicated children. NeuroImage: Clinical. 2015;9:223-232. doi:10.1016/j.nicl.2015.07.018
- Marek S, Tervo-Clemmens B, Calabro FJ, et al. Reproducible brain-wide association studies require thousands of individuals. Nature. 2022;603:654-660. doi:10.1038/s41586-022-04492-9