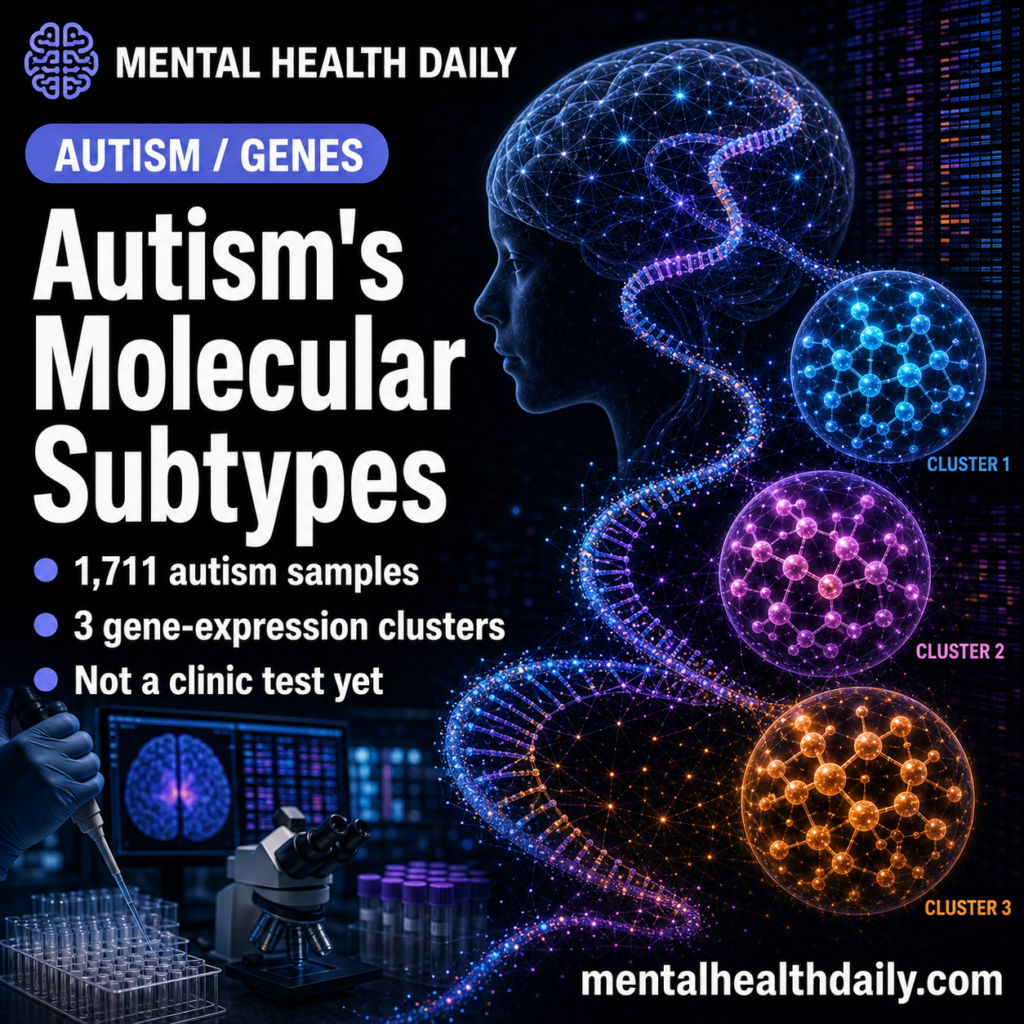
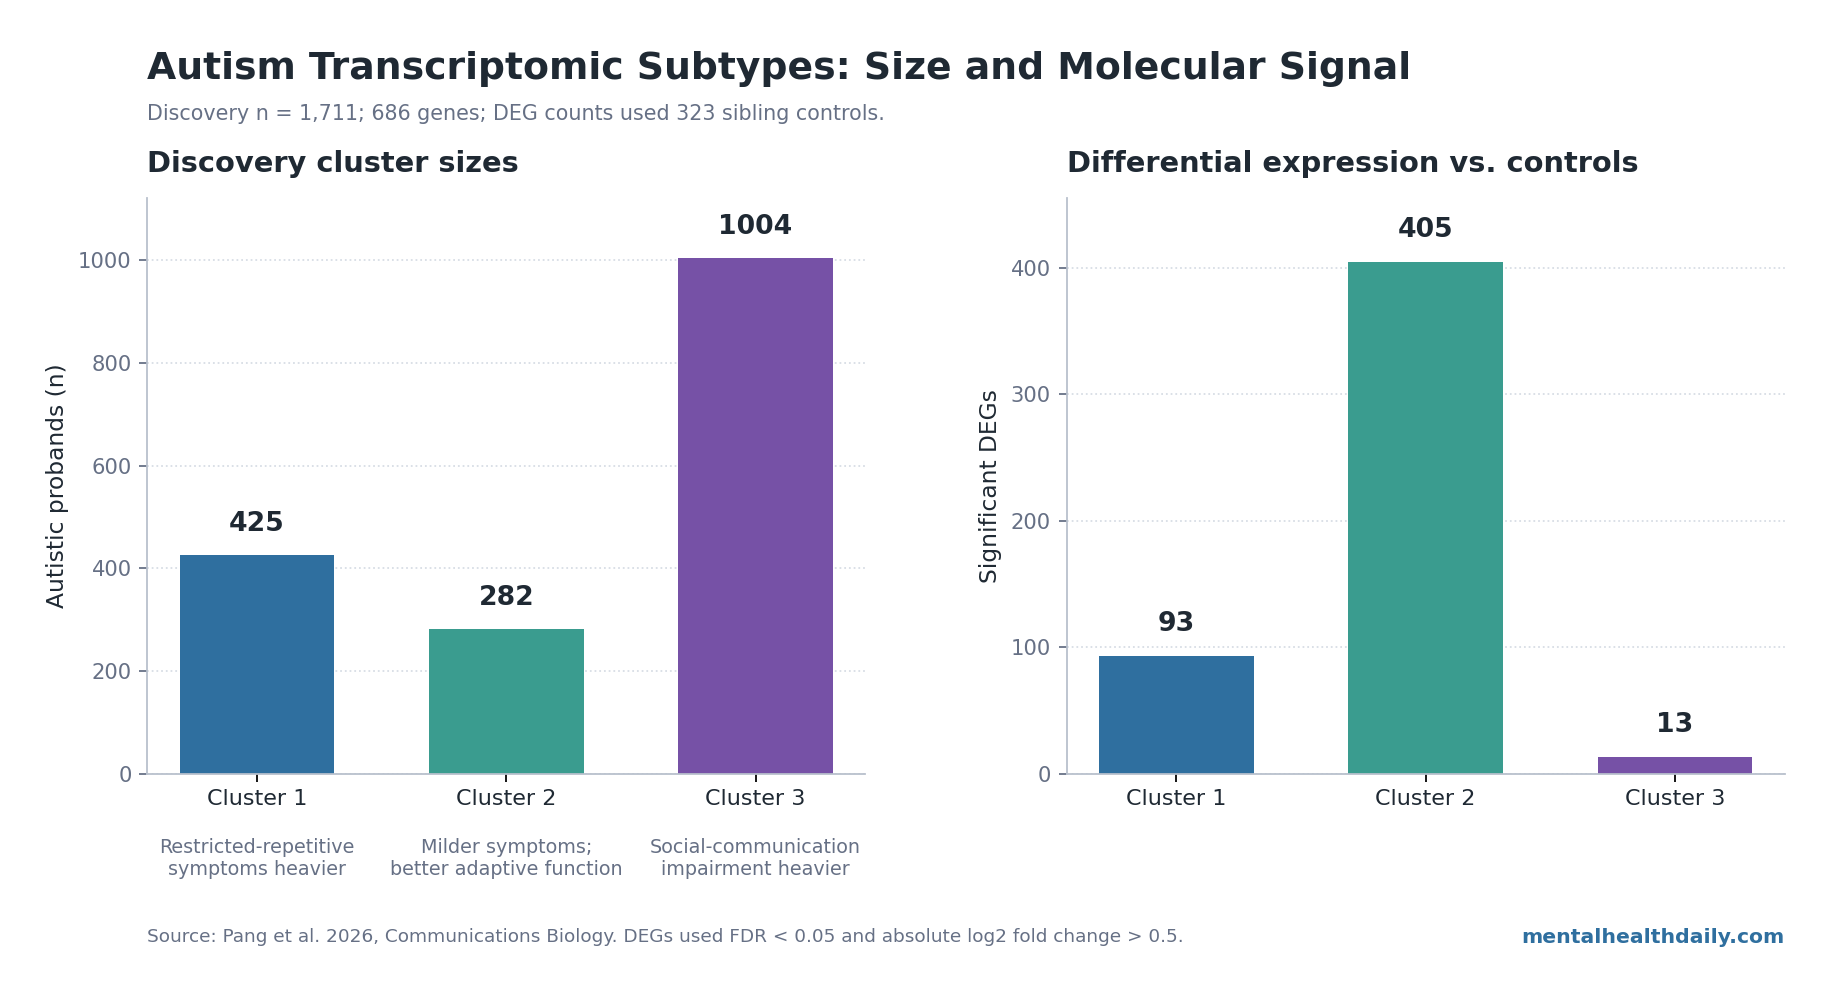
A 2026 RNA-seq analysis of 1,711 autistic probands found 3 gene-expression clusters: 425 people with more severe restricted and repetitive behaviors than the other clusters, 282 with milder symptoms and better adaptive function than the other clusters, and 1,004 with stronger social-communication impairment than the other clusters.1 The supported claim is molecular stratification, not a new diagnostic test: the clusters were reproducible enough to matter scientifically, but not mature enough to assign treatment in clinic.
Research Highlights
- Three clusters split 1,711 autistic probands: Cluster 1 included 425 people with heavier restricted-repetitive symptoms than the other clusters, Cluster 2 included 282 with milder symptoms and better adaptive function than the other clusters, and Cluster 3 included 1,004 with more social-communication impairment than the other clusters.1
- The clustering used 686 symptom-linked genes: Pang et al. first identified genes associated with at least 1 core autism symptom, then used non-negative matrix factorization to group expression patterns rather than starting from DSM-5 severity levels.1
- Biology did not line up as 3 equal mechanisms: discovery analyses found 93 differentially expressed genes in Cluster 1, 405 in Cluster 2, and 13 in Cluster 3, with only 1 gene, MUC13, overlapping all 3 clusters.1
- Replication was strongest in blood: subtype phenotypic profiles matched the discovery set better in the 99-person blood validation dataset than in postmortem brain datasets, with Pearson r = 0.753 in blood vs. r = 0.551 in BA41/42/22 and r = 0.368 in BA17.1
- Treatment matching remains future work: the 3 clusters support subtype-stratified research, but the paper’s own limits include lymphoblastoid-cell discovery data, small validation datasets, incomplete phenotype overlap, and exploratory genetic-burden findings.1
Transcriptomics means measuring which genes are being expressed and how strongly. That is different from sequencing DNA variants: DNA says what inherited and de novo genetic instructions are present, while RNA expression says which instructions are being used in a particular tissue, cell state, and developmental context.
Pang et al. used RNA-seq from lymphoblastoid cell lines in the Simons Simplex Collection. After quality control, the researchers retained 1,711 autistic probands, 20,464 genes, and complete data for 5 core symptom measures from the Autism Diagnostic Observation Schedule (ADOS) and Autism Diagnostic Interview-Revised (ADI-R).1
The paper’s broad hypothesis was supported: a symptom-linked expression matrix could be decomposed into reproducible autism subtypes. That does not make the subtypes clinically actionable.
It means the same diagnosis contained partially separable expression programs, and those programs carried phenotypic signal.
Non-Negative Matrix Factorization Found 3 Autism Expression Clusters
Non-negative matrix factorization (NMF) is a pattern-finding method that breaks a large gene-expression matrix into smaller parts. In this study, NMF reduced expression across 686 symptom-associated genes into metagenes, then assigned samples to clusters based on the metagene patterns.
The 3 discovery clusters were unevenly distributed:
- Cluster 1: 425 of 1,711 probands; more severe autism symptoms than the other clusters, especially restricted and repetitive behaviors.
- Cluster 2: 282 of 1,711 probands; milder symptoms and better adaptive function than the other clusters.
- Cluster 3: 1,004 of 1,711 probands; more pronounced social-communication symptoms and impaired adaptive function.
Pang et al. did not say the 3 clusters were simply 3 named treatment bins. Cluster 1 combined immune and neuronal-system signals.
Cluster 2 had the largest number of differentially expressed genes and strong immune-cell and oxidative-stress signals. Cluster 3 had fewer differentially expressed genes but was linked to morphogenesis of a branching structure, a pathway family relevant to neuronal branching, synapse formation, and broader brain structure.
Cluster 2 Had the Most Differentially Expressed Genes
Differential expression analysis compared each autism cluster with 323 unrelated sibling controls. The headline molecular count was lopsided: 93 significant differentially expressed genes for Cluster 1, 405 for Cluster 2, and 13 for Cluster 3, using false discovery rate below 0.05 and absolute log2 fold change above 0.5.1
Differentially expressed genes are genes whose measured RNA levels differ between groups. They are not automatically causal genes.
In this paper, the DEG pattern is better read as a cluster-specific molecular footprint: Cluster 2 had the broadest expression difference from controls, even though its clinical profile was the mildest.
The cluster biology was not a neat severity ladder. Pang et al. reported these main pathway signals:
- Cluster 1: immune response plus neural-development-related processes, including adaptive immune response, protein-protein interactions at synapses, autonomic nervous system development, B-cell receptor signaling, and regulation of synapse organization.
- Cluster 2: antiviral and anti-inflammatory effects, response to reactive oxygen species, response to bacterium, prenatal-stage enrichment, and immune-cell-associated patterns in brain single-cell comparisons.
- Cluster 3: regulation of morphogenesis of a branching structure, minimal immune-cell expression, and tentative enrichment for developmental-delay and neurodevelopmental-disorder genes before false-discovery correction.
That pattern is more interesting than “3 autism types.” It suggests the same behavioral diagnosis can contain different molecular routes: one route with stronger restricted-repetitive behavior and combined immune-neuronal disruption, one milder route with broad immune and oxidative-response expression differences, and one social-communication-heavy route with a smaller but more developmentally pointed signal.
Validation Worked Best in Blood and Weaker in Brain Tissue
Pang et al. did not leave the result as a single-dataset cluster story. The researchers tested the 3-cluster structure in a whole-blood RNA-seq dataset from 99 Chinese autistic probands and in postmortem brain RNA-seq data from Gandal et al., using BA17 and BA41/42/22 cortical samples.1,2
The blood validation dataset recovered 679 of the 686 symptom-related genes. Among 95 samples with valid phenotype data, Cluster 1 included 16 people, Cluster 2 included 14, and Cluster 3 included 65.
Cluster 2 again showed milder symptoms than the other clusters, while Cluster 1 showed more severe clinical presentation than the other clusters. Phenotype-profile consistency with the discovery set was strong for overlapping Social Responsiveness Scale measures: Pearson r = 0.753, Spearman ρ = 0.781, and directional agreement = 77.8%.1
The brain datasets were less tidy. In BA41/42/22, phenotype-profile consistency was moderate: Pearson r = 0.551, Spearman ρ = 0.462, and directional agreement = 58.3%.
In BA17, consistency was weaker: Pearson r = 0.368, Spearman ρ = 0.406, and directional agreement = 50.0%.1
This does not refute the subtype framework. Postmortem brain datasets are smaller, brain-region-specific, and phenotypically thinner than the discovery cohort.
The gradient still changes the claim: the strongest validation came from blood, while brain-tissue validation preserved only part of the phenotype architecture. Independent brain data therefore do not fully confirm a clinical subtype system.
Earlier Autism Subtyping Work Points in the Same Direction
The Pang study sits inside a more specific autism-subtyping literature, not generic “autism is heterogeneous” background. Bertelsen et al. separated autistic people by imbalance between social-communication symptoms and restricted-repetitive behaviors, then found different neural-circuit patterns across those behavioral subtypes.3
The link is relevant because Pang’s Cluster 1 and Cluster 3 separated the same 2 symptom domains at the transcriptomic level.
Buch et al. pushed the link another level down. Their Nature Neuroscience study connected dimensions of autism-related functional brain connectivity to molecular signaling pathways involving immune function, synaptic activity, G-protein-coupled receptor signaling, and protein synthesis.4
Pang et al. did not copy that method, but the logic is adjacent: symptom and network differences can map to molecular programs instead of floating as purely behavioral labels.
Two molecular-subtyping studies are especially close. Ramaswami et al. used integrative genomics to identify a convergent molecular autism subtype that linked epigenomic and transcriptomic differences.5
Hu and Bi reanalyzed transcriptomic data after phenotypic subtyping and found subgroup-specific pathways and autism-trait-associated genes.6 Pang et al. moved the starting point toward expression-based clustering itself: first derive clusters from symptom-linked RNA expression, then ask whether phenotype and pathway differences follow.
Litman et al. provide a newer top-down comparator. Their 2025 Nature Genetics analysis decomposed autism phenotypic heterogeneity into 4 classes with different genetic programs.7
Pang et al. explicitly noted conceptual overlap: their Cluster 1 resembles a broadly affected class, Cluster 2 resembles a moderate-challenges class, and Cluster 3 resembles a social/behavioral class. The mismatch is informative because autism subtypes will probably not emerge from 1 data layer alone.
The Genetic-Burden Signal Was Exploratory, Not Decisive
The researchers also tested whether the 3 expression clusters differed in common and rare genetic burden. All 3 clusters had higher autism polygenic risk scores than controls, but the paper reported no significant polygenic-risk difference among the clusters themselves.1
De novo variant analysis produced a more suggestive result. The overall association between cluster and mutation-type distribution was statistically significant, with chi-square = 21.921 and p = 0.038.
A stratified test found no-frame-shift mutations differed across clusters, with chi-square = 6.80 and p = 0.033.1
The paper’s own limitation section is the right calibration: these genetic findings are preliminary trends requiring larger independent cohorts. They may help explain why expression clusters carry phenotype differences, but they do not yet define a genetic test for assigning autistic people to the 3 clusters.
Why the Result Is Not a Clinical Autism Subtype Test Yet
The supported claim is narrow and useful: RNA expression patterns can reveal biologically meaningful substructure inside autism. The weaker social-media claim is that autism now has 3 molecular types ready for precision treatment.
Several limits keep the result in the research stage:
- Tissue source: the discovery dataset used lymphoblastoid cell lines, not living brain tissue. These cells can carry useful systemic expression signals, but they are not direct snapshots of cortical development.
- Validation size: the validation cohorts were much smaller than the 1,711-person discovery set, especially the brain datasets of 49 and 35 autistic individuals.
- Phenotype overlap: the blood validation dataset mainly supported overlapping Social Responsiveness Scale patterns, while the brain validation datasets depended on ADI-R overlap.
- Clinical use: no blood test, saliva test, or routine clinical biomarker currently assigns an autistic person to Pang Cluster 1, 2, or 3.
These limits do not make the study trivial. They keep the interpretation honest.
The paper is a stronger argument for subtype-aware research than for immediate subtype-guided treatment.
Questions About Autism Molecular Subtyping
Did Pang et al. prove there are exactly 3 kinds of autism?
No. The NMF model selected 3 clusters because the cophenetic correlation pattern supported rank 3 in this dataset.
Another data layer, age range, tissue source, or longitudinal design could produce a different number of biologically useful subgroups.1
Could these clusters explain why autism treatment trials often look inconsistent?
Possibly, but not yet directly. If a trial enrolls autistic people from multiple molecular subtypes, a treatment aimed at 1 pathway could be diluted by participants whose main biology runs through another pathway.
Pang et al. support that research logic; they did not test a treatment response endpoint.1
Is Cluster 2 “milder” because it has fewer molecular changes?
No. Cluster 2 was clinically milder but had 405 differentially expressed genes, more than Cluster 1 and Cluster 3 in the discovery comparison with controls.
Milder presentation and smaller molecular footprint are not the same thing.1
What would make these subtypes clinically useful?
Clinical use would require replication in larger cohorts, stable assignment from accessible tissue, longitudinal data showing what subtype predicts, and trials showing that subtype assignment changes treatment response. Until then, these are research subtypes, not diagnostic labels.
References
- Pang T, Zheng X, Liu JJ, Lu L, Yang L, Chang S. Transcriptomic analysis in autism spectrum disorder suggests three molecular subtypes with distinct phenotypic profiles and functional pathways. Communications Biology. 2026. doi:10.1038/s42003-026-10059-5
- Gandal MJ, Haney JR, Parikshak NN, et al. Broad transcriptomic dysregulation occurs across the cerebral cortex in ASD. Nature. 2022;611(7936):532–539. doi:10.1038/s41586-022-05377-7
- Bertelsen N, et al. Imbalanced social-communicative and restricted repetitive behavior subtypes of autism spectrum disorder exhibit different neural circuitry. Communications Biology. 2021;4:574. doi:10.1038/s42003-021-02015-2
- Buch AM, Vertes PE, Seidlitz J, et al. Molecular and network-level mechanisms explaining individual differences in autism spectrum disorder. Nature Neuroscience. 2023;26(4):650–663. doi:10.1038/s41593-023-01259-x
- Ramaswami G, Won H, Gandal MJ, et al. Integrative genomics identifies a convergent molecular subtype that links epigenomic with transcriptomic differences in autism. Nature Communications. 2020;11:4873. doi:10.1038/s41467-020-18526-1
- Hu VW, Bi C. Phenotypic subtyping and re-analyses of existing transcriptomic data from autistic probands in simplex families reveal differentially expressed and ASD trait-associated genes. Frontiers in Neurology. 2020;11:578972. doi:10.3389/fneur.2020.578972
- Litman A, et al. Decomposition of phenotypic heterogeneity in autism reveals underlying genetic programs. Nature Genetics. 2025;57:1611–1619. doi:10.1038/s41588-025-02224-z