
A 2026 Molecular Psychiatry study found that RVI-AD, a structural-MRI score measuring how closely a person’s brain anatomy matches an Alzheimer’s disease pattern, predicted mild-cognitive-impairment conversion to dementia most strongly over the next 3 years: OR 2.16, 95% CI 1.81-2.57, p < 2e-16, AUC 0.70.1
Research Highlights
- Short-term conversion signal: in 965 ADNI participants with mild cognitive impairment (MCI), baseline RVI-AD predicted dementia conversion over 0-3 years with OR 2.16, AUC 0.70, sensitivity 0.62, specificity 0.70, PPV 43.7%, and NPV 83.8%.1
- Prediction weakened with time: RVI-AD still predicted 0-12 year conversion, but discrimination fell to AUC 0.66 and OR 1.75, so the score looks more like near-term risk enrichment than a decade-long individual forecast.1
- APOE-e4 moved the MRI score: healthy APOE-e4 carriers had higher RVI-AD in the Amish Connectome Project (d = 0.29, p = 0.03) and UK Biobank (p = 2e-5), while most single-region MRI measures were weaker than RVI-AD or nonsignificant.1
- Cardiovascular risk depended on genotype: Framingham Cardiovascular Risk Score correlated with RVI-AD in APOE-e4 carriers in ACP (r = 0.35, p = 4e-5) and UKBB (r = 0.07, p = 4e-7), but not in noncarriers.1
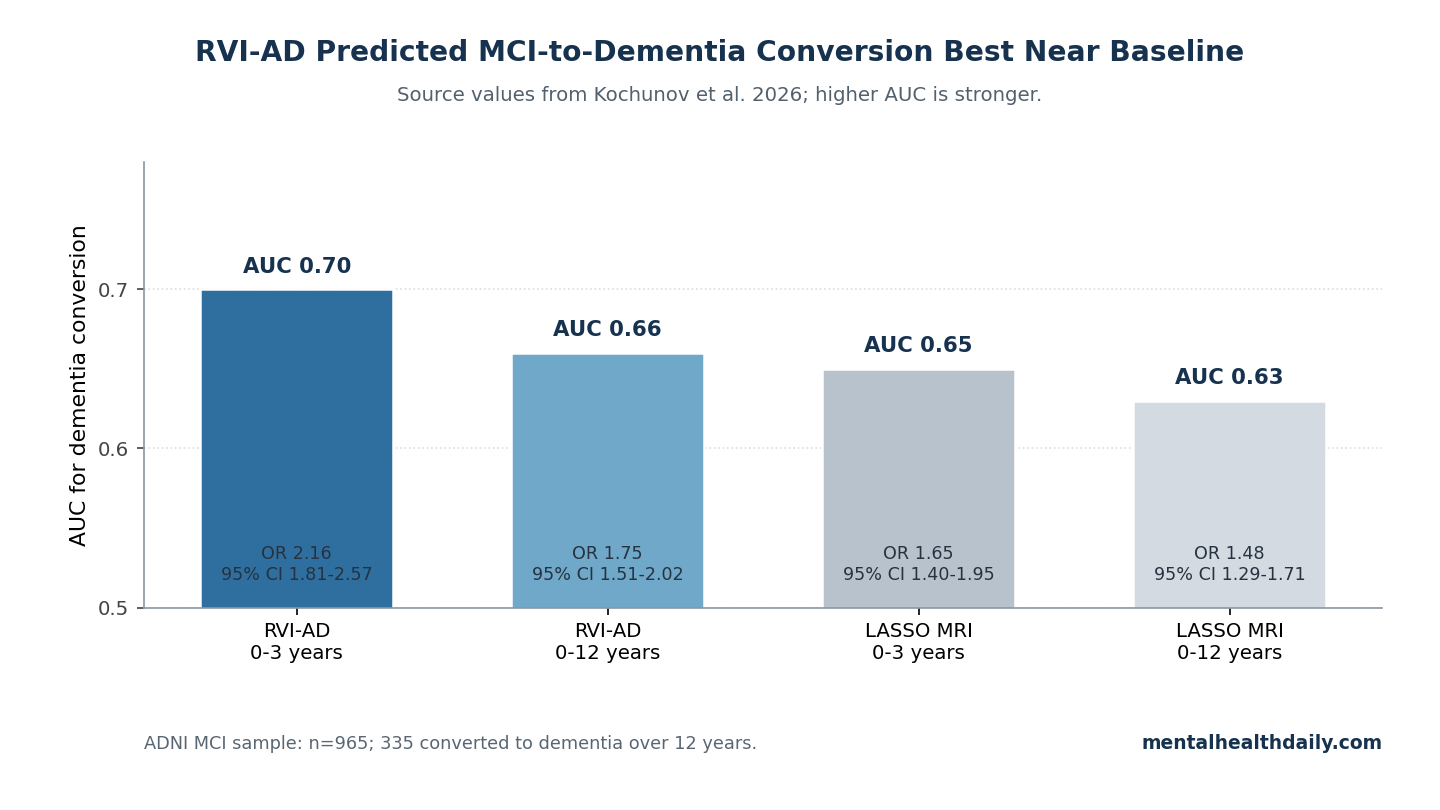
- MRI pattern scoring is not a stand-alone diagnosis: RVI-AD outperformed a LASSO multiregional MRI index for 0-3 year AUC (0.70 vs. 0.65), but the study did not directly compare RVI-AD with amyloid status for predicting dementia conversion.1
RVI-AD stands for Regional Vulnerability Index for Alzheimer’s disease. The method takes many regional brain measurements from a standard anatomical MRI, compares each person’s pattern with the regional deficit pattern seen in amyloid-positive Alzheimer’s disease cases vs. amyloid-negative controls, and collapses that similarity into 1 number.
That design gives RVI-AD a different role from amyloid PET, tau PET, or plasma p-tau217. Molecular biomarkers ask whether Alzheimer’s pathology is present; RVI-AD asks whether the person’s brain structure already resembles the distributed tissue-loss pattern associated with Alzheimer’s disease.2,3
RVI-AD Predicted Dementia Conversion Best Over the First 3 Years
Kochunov et al. tested the most clinically direct question in the Alzheimer’s Disease Neuroimaging Initiative (ADNI), a long-running multicenter biomarker cohort used to benchmark imaging, fluid, genetic, and clinical measures in aging and Alzheimer’s disease.4 Among 965 participants who had MCI at baseline, 335 converted to dementia over 12 years, with an average conversion period of about 3 years.1
MCI means measurable cognitive decline that is more than expected for age but not severe enough to meet dementia criteria. The diagnosis is useful because some patients remain stable, some improve, and some convert to Alzheimer’s-type dementia or another dementia syndrome.
A biomarker is clinically useful only if it helps separate those trajectories better than ordinary clinical observation.
RVI-AD did separate the MCI trajectories. In the aggregate 0-3 year analysis, a higher baseline RVI-AD score predicted conversion with OR 2.16, 95% CI 1.81-2.57, p < 2e-16, AUC 0.70, sensitivity 0.62, specificity 0.70, PPV 43.7%, and NPV 83.8%.1
In plain English: the score was not a crystal ball, but high RVI-AD substantially enriched near-term conversion risk.
The year-by-year numbers sharpen the interpretation. Year 1 discrimination reached AUC 0.74 with sensitivity 74.6% and specificity 66.0%; Year 2 reached AUC 0.72 with sensitivity 76.5% and specificity 60.0%; Year 3 dropped to AUC 0.66 with sensitivity 70.1% and specificity 59.1%.1
The first 2 years after MRI carried the strongest signal.
Over the full 12-year window, RVI-AD remained statistically significant but became less discriminating: OR 1.75, 95% CI 1.51-2.02, p = 8.72e-14, AUC 0.66, sensitivity 0.66, and specificity 0.59.1 That is still meaningful for research enrichment, but it is not the level of certainty implied by casual claims that one MRI can predict Alzheimer’s disease years in advance.
A Whole-Brain Pattern Beat a Generic Multiregion MRI Index
One useful feature of the paper is that the researchers did more than compare RVI-AD against isolated brain regions. They also built a least absolute shrinkage and selection operator (LASSO) logistic-regression score from the same whole-brain regional MRI data, trained to classify amyloid-positive Alzheimer’s cases vs. amyloid-negative controls and then applied to the MCI conversion sample.1
LASSO is a statistical method that selects a smaller set of predictors by penalizing less useful variables. In this context, it created another multiregional MRI index, but without the same explicit RVI logic of aligning an individual’s regional deviations with a known Alzheimer’s deficit pattern.
For 0-3 year conversion, the LASSO index reached OR 1.65, 95% CI 1.40-1.95, p = 2.75e-9, and AUC 0.65. For 0-12 year conversion, it reached OR 1.48, 95% CI 1.29-1.71, p = 5.3e-8, and AUC 0.63.1
RVI-AD was better at both horizons: AUC 0.70 vs. 0.65 over 0-3 years and AUC 0.66 vs. 0.63 over 12 years.
The gain is modest, not magical. The important point is that a biologically anchored similarity score outperformed a more generic multiregional MRI classifier on the same conversion problem.
RVI-AD is more than “more MRI variables.” It is a specific way of asking whether the pattern across regions resembles the Alzheimer’s disease anatomy map.
APOE-e4 and Cardiovascular Risk Moved RVI-AD Before Dementia
The paper’s healthy-cohort analyses ask a different question: can RVI-AD detect the brain imprint of known Alzheimer’s risk factors before clinical dementia? Researchers tested 335 participants in the Amish Connectome Project and then sought replication in 26,010 UK Biobank participants.1
APOE-e4 is a common version of the apolipoprotein E gene that raises late-onset Alzheimer’s disease risk, partly through lipid transport, amyloid biology, and vascular pathways. In the Amish Connectome Project, 91 APOE-e4 carriers had higher RVI-AD than noncarriers, with Cohen’s d = 0.29 and p = 0.03.1
In UK Biobank, APOE-e4 carriers also had higher RVI-AD, p = 2e-5.
Single-region MRI measures were less convincing. In the Amish cohort, hippocampal volume did not differ by APOE-e4 status (d = -0.01, p = 0.8), and temporal, parietal, and frontal cortical thickness measures were all p > 0.7.
In UK Biobank, hippocampal volume was lower in APOE-e4 carriers at p = 0.01, but the result did not survive correction for multiple comparisons.1
The cardiovascular pattern was more conditional. Framingham Cardiovascular Risk Score is a composite estimate of 10-year cardiovascular-event risk based on variables such as age, cholesterol, blood pressure, diabetes, and smoking.
In ACP, the full model was significant (F = 4.6, p = 0.0002), with FCVRS as a main effect (p = 0.006) and an APOE-e4 by FCVRS interaction (p = 0.03). FCVRS correlated with RVI-AD in APOE-e4 carriers (r = 0.35, p = 4e-5), but not in noncarriers (r = 0.02, p = 0.95).1
UK Biobank replicated the interaction in a much larger sample. The model was significant (F = 8.8, p = 7e-6), with FCVRS (p = 2e-4), APOE-e4 genotype (p = 0.01), and their interaction (p = 5e-4) each contributing to RVI-AD.
FCVRS correlated with RVI-AD in APOE-e4 carriers (r = 0.07, p = 4e-7), but not in noncarriers (r = 0.00, p = 0.7).1
Vascular-genetic convergence: the cardiovascular-risk signal was more specific than the obvious read that “older and sicker people had worse brain scans.” The RVI-AD signal was stronger when cardiovascular risk traveled with APOE-e4 status, suggesting that vascular and genetic risk may converge on an Alzheimer’s-like structural pattern before dementia is diagnosed.
RVI-AD Belongs Beside, Not Above, Amyloid and Tau Biomarkers
Biomarker category: Alzheimer’s biomarker frameworks now separate pathology markers from downstream injury markers. Amyloid PET and cerebrospinal-fluid or blood amyloid markers indicate amyloid pathology; tau PET and phosphorylated tau markers indicate tau-related pathology; structural MRI reflects tissue loss, neurodegeneration, and the cumulative consequences of several biological pathways.2,3
RVI-AD sits in that last category. It does not directly measure amyloid plaques or tau tangles.
It measures whether the brain’s regional structure resembles an Alzheimer’s disease deficit pattern built from amyloid-positive Alzheimer’s cases and amyloid-negative controls.1
That distinction cuts both ways. Structural MRI is more widely available than PET, easier to integrate into existing imaging workflows, and already part of many dementia evaluations.
But structural MRI is also less specific: vascular injury, aging, hippocampal sclerosis, mixed neurodegenerative disease, and scanner or processing differences can all influence brain volume and cortical-thickness measures.
Plasma p-tau217 illustrates the contrast. Palmqvist et al. reported high discriminative accuracy for plasma phospho-tau217 in Alzheimer’s disease vs. other neurodegenerative disorders, making blood-based tau an increasingly strong candidate for scalable pathology screening.3
RVI-AD answers a different question: how much Alzheimer’s-like structural consequence is already visible in the brain?
The strongest future use is probably multimodal. RVI-AD could help combine molecular evidence of Alzheimer’s pathology, structural evidence of downstream tissue change, APOE genotype, cardiovascular risk, and clinical trajectory.
A single MRI score should not be sold as a replacement for that layered model.
Older MRI Studies Already Pointed Toward Pattern-Based Prediction
The RVI-AD paper is not the first attempt to predict MCI conversion from MRI. Its contribution is the specific Alzheimer’s-pattern similarity score and the cross-cohort validation, not the broad idea that brain imaging can forecast decline.
Risacher et al. analyzed baseline 1.5T MRI scans from 693 ADNI participants and found that MCI converters already showed structural features closer to probable Alzheimer’s disease than stable MCI participants.5 That earlier work supports the same basic premise: imminent converters often look biologically different before the clinical diagnosis changes.
Furney et al. tested whether combining routine-access markers would improve prediction. In a study of people with MCI, serum inflammatory markers plus automated MRI imaging analysis produced an AUC of 0.78 in an MRI subset.6
The exact marker set differs from RVI-AD, but the practical aim is similar: improve risk stratification without relying on a single clinical impression.
Chao et al. followed 48 people with MCI and found that 13 became demented over about 2.7 years. Baseline hippocampal volume predicted conversion, and arterial-spin-labeling perfusion MRI measures in regions such as right inferior parietal and right middle frontal cortex were also associated with conversion risk.7
That smaller study fits the same MRI-prediction lineage, although its sample size and imaging modality differ from Kochunov et al.
RVI-AD advances this lineage by making the MRI signal more explicitly pattern-based. Instead of asking whether one region is small or one perfusion region is low, it asks whether the whole-brain regional vector points in the Alzheimer’s direction.
Limits of the 2026 RVI-AD Study
The evidence is strong enough to take RVI-AD seriously as a research biomarker, but several limits should keep the claim calibrated.
- Moderate discrimination: AUC 0.70 over 0-3 years is useful, but it is not diagnostic certainty. At the reported threshold, PPV was 43.7% and NPV was 83.8%, meaning a low score was more reassuring than a high score was definitive.1
- Time dependence: prediction was strongest in the first 2-3 years after MRI, while the longer 12-year window fell to AUC 0.66.1
- No direct amyloid-conversion comparison: the researchers used amyloid-positive Alzheimer’s cases and amyloid-negative controls to build the deficit map, but did not directly compare RVI-AD vs. amyloid status for predicting conversion to dementia.1
- Processing pipeline barrier: RVI-AD depends on standardized anatomical MRI processing and regional phenotypes, more than a radiologist looking at a scan.
- Population transfer: ACP, UK Biobank, and ADNI differ in age, environment, recruitment, and risk structure, so clinical deployment would need validation in ordinary memory-clinic and primary-care imaging populations.
None of those limits erase the finding. They prevent the wrong public translation: RVI-AD is not “MRI predicts Alzheimer’s disease” in the deterministic sense.
It is a moderate, biologically interpretable risk-enrichment score that performed best when the clinical question was near-term conversion among people already diagnosed with MCI.
Questions About RVI-AD and Dementia Prediction
Does RVI-AD mean an MRI can diagnose Alzheimer’s disease early?
No. RVI-AD is a structural-pattern risk marker, not a direct amyloid or tau test.
A high score means the person’s MRI pattern looks more Alzheimer’s-like and was associated with higher conversion risk in ADNI; it does not prove that a specific patient has Alzheimer’s pathology or will develop dementia.
How strong was the RVI-AD prediction in MCI?
The best result was near-term: 0-3 year MCI-to-dementia conversion had OR 2.16, AUC 0.70, sensitivity 0.62, specificity 0.70, PPV 43.7%, and NPV 83.8%. The 12-year cumulative prediction remained significant but weaker at OR 1.75 and AUC 0.66.1
Why does APOE-e4 change how cardiovascular risk relates to RVI-AD?
The study found that FCVRS correlated with RVI-AD in APOE-e4 carriers but not in noncarriers, in both ACP and UK Biobank. That pattern suggests vascular risk may leave a more Alzheimer’s-like structural imprint when it occurs in a genetically higher-risk background, although the study cannot prove the biological pathway from association alone.1
Should patients ask for RVI-AD testing now?
Not as a routine clinical test. RVI-AD remains a research-grade MRI-processing biomarker.
Patients with cognitive symptoms should still be evaluated through established clinical assessment, appropriate structural imaging, and, when indicated, validated amyloid, tau, or blood-based biomarker pathways.
Where would RVI-AD be most useful if validated?
The most plausible use is risk stratification among people with MCI or elevated Alzheimer’s risk: selecting higher-risk participants for prevention trials, deciding who needs closer follow-up, and adding a structural-MRI layer to multimodal models that already include molecular biomarkers and clinical trajectory.
References
- Kochunov P, Gao S, Salminen LE, et al. Alzheimer’s disease-like brain pattern biomarker: capturing risks and predicting disease onset. Molecular Psychiatry. 2026. doi:10.1038/s41380-026-03617-0
- Jack CR Jr, Bennett DA, Blennow K, et al. NIA-AA Research Framework: toward a biological definition of Alzheimer’s disease. Alzheimer’s & Dementia. 2018;14(4):535-562. doi:10.1016/j.jalz.2018.02.018
- Palmqvist S, Janelidze S, Quiroz YT, et al. Discriminative accuracy of plasma phospho-tau217 for Alzheimer disease vs other neurodegenerative disorders. JAMA. 2020;324(8):772-781. doi:10.1001/jama.2020.12134
- Petersen RC, Aisen PS, Beckett LA, et al. Alzheimer’s Disease Neuroimaging Initiative (ADNI): clinical characterization. Neurology. 2010;74(3):201-209. doi:10.1212/WNL.0b013e3181cb3e25
- Risacher SL, Saykin AJ, West JD, et al. Baseline MRI predictors of conversion from MCI to probable AD in the ADNI cohort. Current Alzheimer Research. 2009;6(4):347-361. doi:10.2174/156720509788929273
- Furney SJ, Kronenberg D, Simmons A, et al. Combinatorial markers of mild cognitive impairment conversion to Alzheimer’s disease: cytokines and MRI measures together predict disease progression. Journal of Alzheimer’s Disease. 2011;26 Suppl 3:395-405. doi:10.3233/JAD-2011-0044
- Chao LL, Buckley ST, Kornak J, et al. ASL perfusion MRI predicts cognitive decline and conversion from MCI to dementia. Alzheimer Disease and Associated Disorders. 2010;24(1):19-27. doi:10.1097/WAD.0b013e3181b4f736