
A 2026 Australian ecological model found that 20-year-lagged cumulative population blood-lead burden was nonlinearly tied to motor neuron disease mortality (lead spline p = 0.00024), while national insecticide use did not independently explain the curve after adjustment (p = 0.39).1 That is a real lead signal, but it is still population-level evidence, not proof that leaded gasoline caused any individual ALS case.
Research Highlights
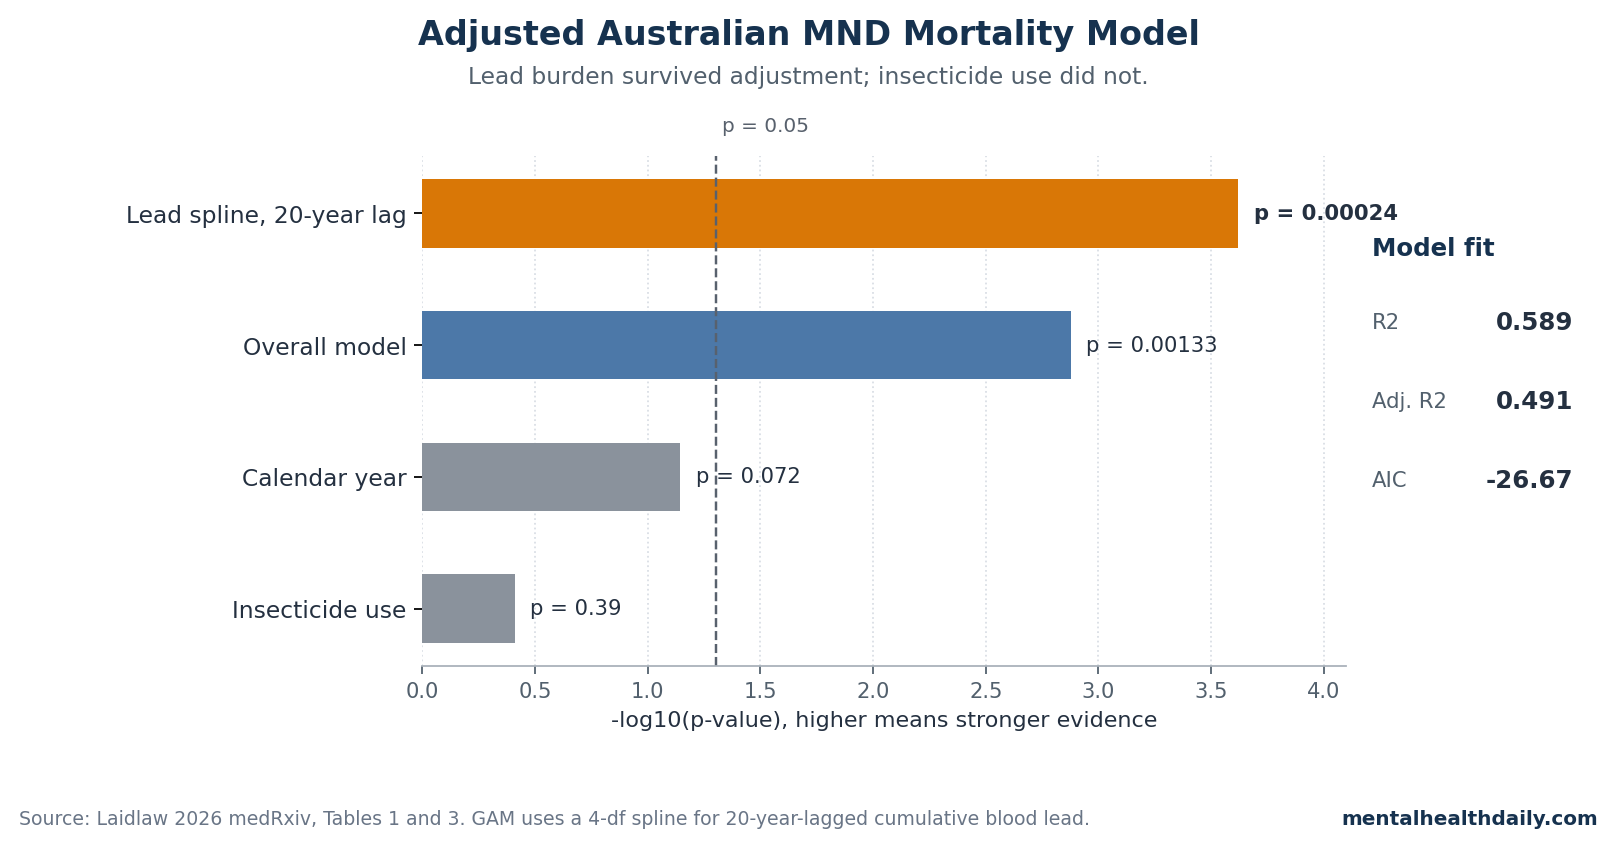
- Lead was the dominant adjusted signal: the 1996–2022 generalized additive model found a significant 20-year-lagged cumulative blood-lead spline (p = 0.00024) and explained 58.9% of annual variation in Australian age-standardized MND mortality.1
- Insecticides did not survive the same model: national log-transformed insecticide use per capita was not independently associated with MND mortality after lead and year were included (p = 0.39).1
- The lag is source-specific, not decorative: Laidlaw et al. previously tested 10–24 year forward lags and reported that a 20-year lag gave the best fit for accumulated petrol-lead exposure and Australian MND mortality.3
- Australia’s mortality curve is the clinical hook: Lee et al. reported that Australian MND deaths rose from 238 in 1986 to 781 in 2023, a more than 3-fold increase that genetics alone cannot explain over 37 years.2
- The causal claim remains bounded: the lead finding is consistent with Australian ecological studies from 2015 and 2017, but a 27-year national time series cannot replace individual bone-lead, blood-lead, occupational, and incidence data.34
Motor neuron disease (MND), the Australian and British term that usually overlaps with amyotrophic lateral sclerosis (ALS), is mostly sporadic. Familial forms account for roughly 10% of cases, so a rapid national rise invites environmental explanations without making any single exposure guilty by default.1
The 2026 Laidlaw preprint asks a sharper question than “could pollution matter?”: did Australia’s historical leaded-gasoline exposure curve reappear, about 20 years later, in national MND mortality?
The 2026 Model Tested Lead Burden, Insecticides, and Calendar Year Together
Laidlaw analyzed annual Australian age-standardized MND mortality from 1996–2022 using a generalized additive model, or GAM — a regression approach that can fit curved exposure-response relationships instead of forcing a straight line. The main exposure was a reconstructed cumulative blood-lead index derived from Australian biomonitoring data and shifted forward by 20 years to approximate delayed disease latency.1
The model also included national insecticide use and calendar year as controls. Insecticide use per capita was log-transformed because raw use was skewed, and calendar year was included to account for broad secular changes such as aging, diagnosis, reporting, and other time-linked factors.1
That setup matters because the lead result was more than a visual overlay of 2 rising curves. The adjusted model reported:
- Lead spline: p = 0.00024 for the joint test of the 4-degree-of-freedom cumulative blood-lead spline.
- Model fit: R² = 0.589 and adjusted R² = 0.491, meaning the model accounted for about 58.9% of year-to-year variation before adjustment for model complexity.
- Overall model: F(5,21) = 6.01, p = 0.00133.
- Insecticide use: p = 0.39 after adjustment, not an independent national-level predictor in this model.
- Calendar year: p = 0.072 in the abstract and Table 1, best read as borderline rather than clearly significant.
The Lead Finding Is Nonlinear, more than a Simple Upward Trend
The strongest part of the paper is the nonlinear lead term. The preprint reports that lower cumulative lead burdens had a shallower relationship with predicted MND mortality, while mid-range cumulative burdens corresponded to a steeper rise in predicted mortality.1
In plain English, the model does not say every extra unit of historical lead exposure had the same effect at every level. It says the exposure-response curve bent.
That shape is biologically plausible for a legacy toxicant. Lead body burden is more than yesterday’s blood-lead level.
Lead accumulates in bone, can persist for decades, and can be remobilized into circulation later in life, especially when bone turnover changes.8 A national exposure pulse in the 1960s and 1970s could therefore remain relevant to diseases that emerge in middle or late adulthood.
The historical exposure curve in the paper is also specific. Australian petrol-lead emissions rose after 1958, peaked in the early 1970s at approximately 8,000 tonnes annually, and declined until lead was removed from Australian gasoline in 2002.1
The reconstructed blood-lead spline closely tracked petrol-lead emissions across 1976–2022 (r = 0.9781; R² = 0.9568; p = 1.425e-18), supporting the assumption that gasoline lead dominated population lead burden during that era.1
Prior Australian Studies Make the 20-Year Lag Less Arbitrary
The 20-year lag is not a post-hoc label pasted onto a pretty curve. Laidlaw et al. previously tested forward lags from 10 to 24 years between accumulated petrol-lead emissions and Australian MND mortality outcomes and reported that 20 years produced the best model fit.3
Zahran et al. later examined lifetime petrol lead exposure against national age-specific and state-level standardized MND death rates in Australia, again tying the exposure history to the mortality pattern rather than to a generic heavy-metal warning.4
The 2026 update improves that older argument by letting the lead relationship bend with a spline, which is a better fit for toxicology than assuming a straight-line dose response. It also adds national insecticide use and calendar year to the same model, so the lead term has to compete against a plausible pesticide alternative and broad time trends.1
That does not make the inference causal. It does make the old leaded-gasoline hypothesis harder to dismiss as a casual overlay.
A lead spline with p = 0.00024 after adjustment is materially different from a chart that simply places emissions and mortality on the same axis.
Pesticide Evidence Still Matters, but It Answers a Different Question
Pesticides and ALS remain relevant because occupational studies ask a different question from Laidlaw’s national model. Malek et al. reviewed pesticide exposure as an ALS risk factor, and Chen et al. later tested occupational chemical and pesticide exposure in a New Zealand case-control study.1011
Those designs can detect high-exposure jobs and specific exposure histories that a national kilograms-per-person insecticide variable will blur.
Laidlaw’s result therefore should not be read as “pesticides do not matter for ALS.” The cleaner read is narrower: per-capita Australian insecticide use did not independently explain the national MND mortality curve once the 20-year-lagged cumulative lead burden and calendar year were included (p = 0.39).1 Occupational pesticide effects and a population-level leaded-gasoline signal can both be true if they operate in different exposure bands.
The Main Weakness Is Ecological Inference
Ecological inference means the exposure and outcome are measured for a population, not linked person by person. The Laidlaw model can say Australia’s reconstructed population blood-lead burden lined up with national MND mortality after a 20-year lag.
It cannot say that the individuals who died of MND were the individuals with the highest bone-lead or blood-lead burden.
Several limits follow from that design:
- Mortality is not incidence: ICD-10 G12.2 death data are not new-diagnosis data. Survival, death certification, diagnostic specificity, and care access can alter mortality curves.
- Exposure reconstruction is indirect: the cumulative blood-lead index uses digitized historical biomonitoring and spline estimation rather than direct individual measurements.
- Co-exposures remain possible: diesel exhaust, solvents, smoking, occupational mixtures, diet, and other long-latency exposures moved across the same decades.
- The paper is a preprint: medRxiv explicitly notes that the work has not been peer reviewed and should not be used to guide clinical practice.1
The best next test would not be another national overlay. It would be an individual-level cohort or case-control study that measures bone lead or well-validated cumulative exposure history, separates incidence from survival, and includes occupational pesticide and solvent data.
Fang et al.’s ALS survival work and Wang et al.’s 2026 dementia cohort show why biomarker-anchored lead studies matter: they move from population history toward measured cumulative body burden.67
What the Leaded-Gasoline Signal Changes
For public health, the implication is not chelation clinics or personal panic. It is legacy-exposure accounting.
Leaded gasoline may be gone from Australian road fuel, but lead remains in old soil, dust, housing, some industrial settings, and aviation gasoline in multiple countries. If historical gasoline lead contributed even modestly to later neurodegenerative risk, the prevention window was decades earlier than diagnosis.
For individuals who grew up during the leaded-gasoline era, the result does not produce a personal ALS risk calculator. Baseline lifetime ALS/MND risk remains low, and the 2026 model is not built to translate a childhood city, birth year, or blood-lead estimate into individual probability.
The useful personal lesson is more general: avoid ongoing lead exposure, test children in legacy-contaminated settings, remediate known lead hazards, and treat unproven adult “detox” claims with skepticism.
The calibrated conclusion is simple: Laidlaw’s adjusted model strengthens the case that Australia’s MND mortality rise may carry a delayed leaded-gasoline signature. It does not close the causal file.
The lead term is strong enough to deserve individual-level replication, and the ecological design is weak enough that replication still matters.
Questions About Leaded Gasoline and ALS in Australia
Did Laidlaw 2026 prove that leaded gasoline caused Australia’s MND rise?
No. The model found a strong adjusted ecological association: the 20-year-lagged cumulative blood-lead spline had p = 0.00024 and the full model explained 58.9% of annual MND mortality variation.1
Causation still requires individual-level exposure and disease data.
Why use a 20-year lag instead of matching lead exposure and deaths in the same year?
ALS/MND develops after long biological latency, and lead can persist in bone for decades. Laidlaw et al. previously tested 10–24 year lags and reported that 20 years gave the best fit between accumulated petrol-lead emissions and Australian MND mortality.3
Did the model rule out pesticides as an ALS risk factor?
No. It only found that national per-capita insecticide use was not an independent predictor of Australia’s MND mortality curve after lead and year were included (p = 0.39).1
Occupational pesticide studies can still be relevant for workers with higher exposures.
Should adults exposed to leaded gasoline get bone-lead testing?
The paper does not support routine personal screening. Bone-lead measurement is useful in research because it captures cumulative exposure, but Laidlaw 2026 does not define a clinical threshold, an ALS prediction rule, or a treatment pathway for asymptomatic adults.
Why does this analysis use ALS and MND together?
The Australian mortality data use motor neuron disease coding, while many readers search for ALS. MND is the broader regional label; ALS is the most familiar subtype term.
the study’s outcome is national MND mortality under ICD-10 G12.2, not a clinic-confirmed ALS incidence cohort.1
Can this preprint guide clinical care?
No. medRxiv labels the paper as not peer reviewed and not suitable for guiding clinical practice.1
Its value is hypothesis-strengthening for environmental epidemiology, not patient-level diagnosis, screening, or treatment.
References
- Historical Petrol Lead Emissions and Motor Neurone Disease Mortality in Australia. Laidlaw MAS. medRxiv. 2026. doi:10.1101/2025.11.06.25339701
- Motor neuron disease mortality trends in Australia from 1986 to 2023: a population-based study. Lee CMY et al. Medical Journal of Australia. 2026. doi:10.5694/mja2.70168
- A temporal association between accumulated petrol (gasoline) lead emissions and motor neuron disease in Australia. Laidlaw MA et al. International Journal of Environmental Research and Public Health. 2015;12(12):16124-16135. doi:10.3390/ijerph121215047
- Motor neuron disease mortality and lifetime petrol lead exposure: evidence from national age-specific and state-level age-standardized death rates in Australia. Zahran S et al. Environmental Research. 2017;153:181-190. doi:10.1016/j.envres.2016.11.023
- Population-based study of environmental/occupational lead exposure and amyotrophic lateral sclerosis: a systematic review and meta-analysis. Meng E et al. Neurological Sciences. 2020;41(1):35-40. doi:10.1007/s10072-019-04067-z
- Blood lead, bone turnover, and survival in amyotrophic lateral sclerosis. Fang F et al. American Journal of Epidemiology. 2017;186(9):1057-1064. doi:10.1093/aje/kwx176
- Exposure to lead and incidence of Alzheimer’s disease and all-cause dementia in the United States. Wang X et al. Alzheimer’s & Dementia. 2026;22(2):e71075. doi:10.1002/alz.71075
- Bone lead as a biological marker in epidemiologic studies of chronic toxicity: conceptual paradigms. Hu H et al. Environmental Health Perspectives. 1998;106(1):1-8. doi:10.1289/ehp.981061
- Lead-Induced Motor Dysfunction Is Associated with Oxidative Stress, Proteome Modulation, and Neurodegeneration in Motor Cortex of Rats. Leao LKR et al. Oxidative Medicine and Cellular Longevity. 2021;2021:5595047. doi:10.1155/2021/5595047
- Pesticide exposure as a risk factor for amyotrophic lateral sclerosis: a meta-analysis of epidemiological studies. Malek AM et al. Environmental Research. 2012;117:112-119. doi:10.1016/j.envres.2012.06.007
- Occupational exposures to pesticides and other chemicals: a New Zealand motor neuron disease case-control study. Chen GX et al. Occupational and Environmental Medicine. 2022;79(6):412-420. doi:10.1136/oemed-2021-108056