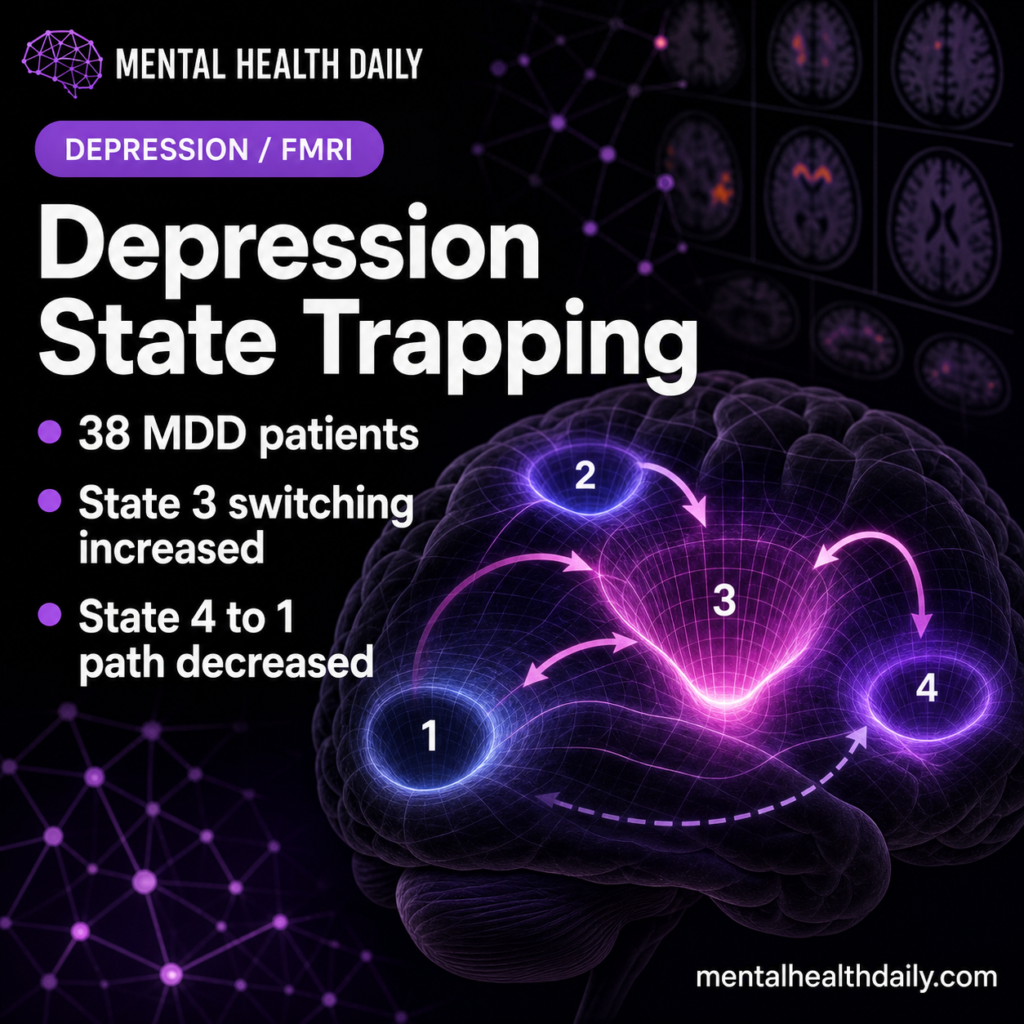
A 76-person Nature Communications fMRI study found that people with major depressive disorder spent a higher share of time in a model-derived State 3 than healthy controls, 27.63 vs. 25.65, p(FDR) = 0.035, and State 3 occupancy correlated with QIDS depression severity, r2 = 0.268, p(FDR) = 0.008.1 The result points to altered brain-state transitions in depression, not a diagnostic brain scan.
Research Highlights
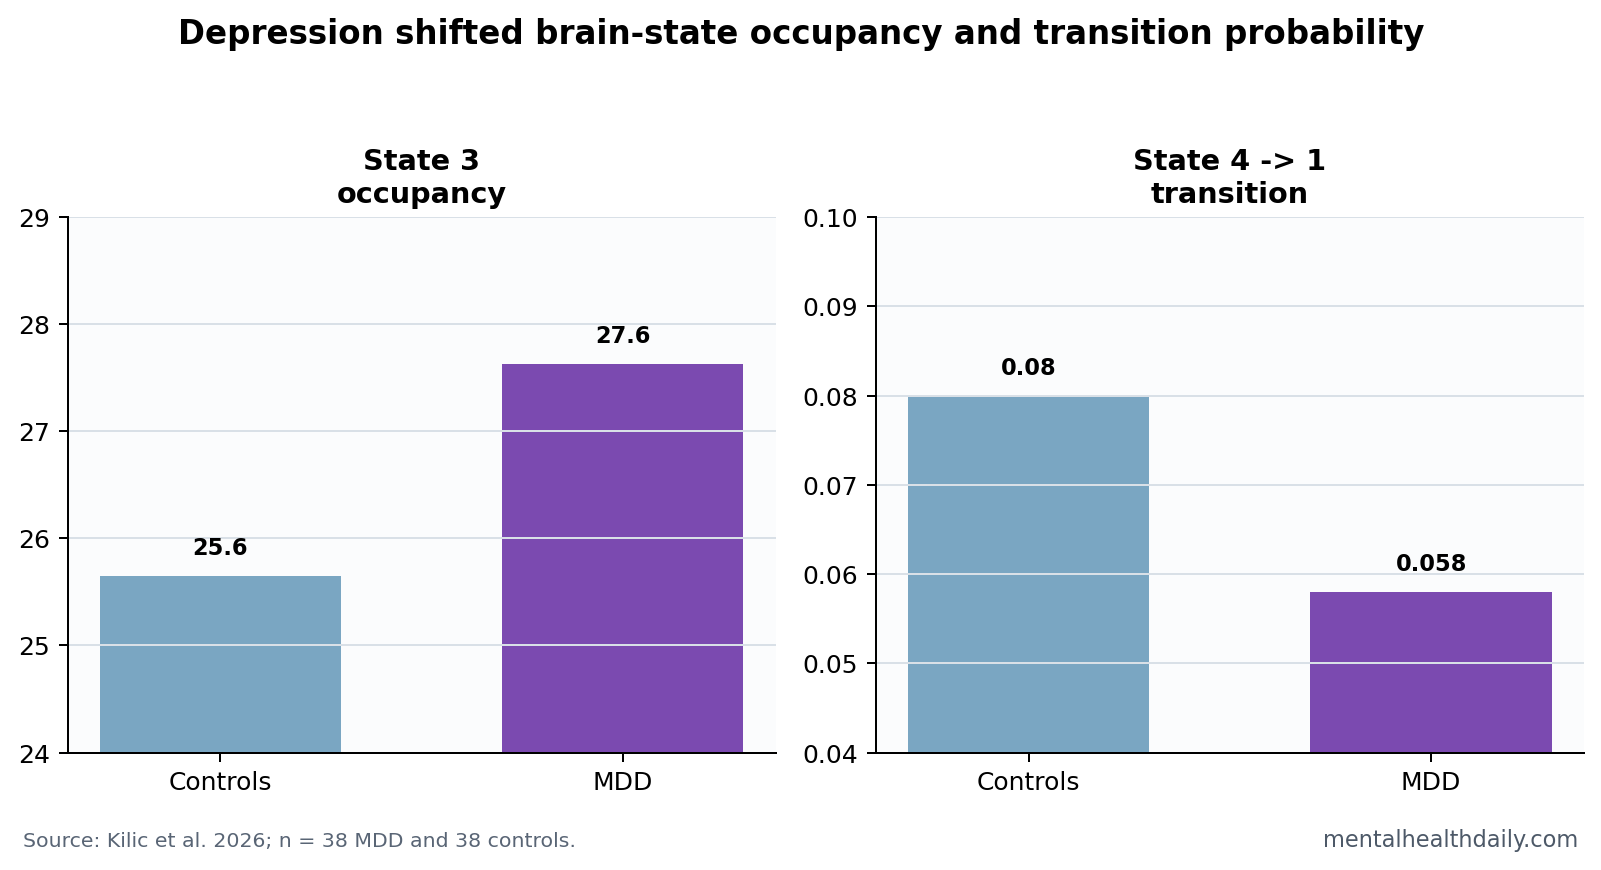
- State 3 occupancy was higher: MDD participants had higher State 3 fractional occupancy than controls, 27.63 vs. 25.65, p(FDR) = 0.035.1
- Severity tracked State 3: State 3 fractional occupancy correlated with QIDS depression severity inside MDD, r2 = 0.268, p(FDR) = 0.008.1
- Helpful transitions were lower: State 4 to State 1 transition probability was lower in MDD, 0.058 vs. 0.080, p(FDR) = 0.042.1
- Distress moved with transition loss: State 4 to State 1 transition probability was inversely related to general distress, r2 = 0.410, p(FDR) = 0.003.1
- Sample size was modest: The study involved 38 MDD patients and 38 controls, so state labels need replication before clinical use.
Brain energy landscape is a model of how easily the brain moves between activity states. A state that the brain enters often or struggles to leave can be described as an attractor-like pattern, but the term is mathematical shorthand rather than a visible brain location.
QIDS means Quick Inventory of Depressive Symptomatology, a symptom scale used to quantify depression severity. In this study, QIDS and related measures helped connect brain-state dynamics to clinical symptoms rather than leaving the fMRI result as an abstract network pattern.
State 3 Was More Frequent but Less Stable in MDD
Kilic et al. analyzed resting-state fMRI from 38 people with MDD and 38 healthy controls.1 The researchers clustered brain activity into 4 recurring states and then tested how often participants entered, occupied, and transitioned between those states.
State 3 was characterized by low-amplitude activity in frontoparietal and default-mode regions and higher activity in visual and dorsal-attention systems. MDD participants showed higher fractional occupancy, 27.63 vs. 25.65, while entering and exiting State 3 more often.
Plain English: the depressed brain signal looked more like repeated switching into and out of a reactive state than like calm, sustained residence in one state. That pattern is why “state trapping” needs nuance: occupancy increased, but dwell time did not tell the whole story.
State 3 Occupancy Tracked Depression Severity
The State 3 result became clinically more relevant because it tracked symptoms. In MDD participants, State 3 fractional occupancy correlated with QIDS depression severity, r2 = 0.268, p(FDR) = 0.008.1
Entry into and exit from State 3 also related to depression and anhedonia measures. Anhedonia means reduced ability to feel pleasure or interest. A state-transition finding linked to anhedonia is more meaningful than a state label alone because anhedonia is a central clinical feature of depression.
Static depression connectivity studies have long implicated default-mode and control networks.2 Dynamic-state analysis adds timing: it asks which networks differ and how the brain moves between patterns over time.
State 4 to State 1 Transitions Were Lower in Depression
Another key result involved reduced transition probability from State 4 to State 1. Controls showed a mean probability of 0.080, while MDD participants showed 0.058, p(FDR) = 0.042.1
The clinical model is directional. As State 4 to State 1 transition probability increased, depression, anxiety, rumination, and distress scores decreased. The strongest displayed association was with general distress, r2 = 0.410, p(FDR) = 0.003.
- State 3 pattern: higher occupancy and more switching in MDD.
- State 4 to 1 pattern: lower transition probability in MDD.
- Symptom link: less State 4 to 1 movement aligned with more distress.
Network Control Theory Keeps the Claim Mechanistic
Network control theory uses structural brain connections to estimate how much energy would be needed to move the brain from one activity state to another. In this paper, that framework linked depression dynamics to structural constraints rather than treating fMRI states as free-floating labels.
The model suggested that some transitions in MDD followed more demanding routes, especially State 3 to State 2, while transitions such as State 4 to State 1 were less available. Earlier network-control work showed why structural wiring can constrain brain-state movement.3
Evidence-strength note: this was a research fMRI and diffusion-imaging analysis, not a treatment trial. It can describe depression-linked brain dynamics. It cannot prove that stimulating a region, changing a network, or targeting State 3 would improve symptoms.
The State Labels Are Model Outputs, Not Brain Regions
State 1, State 2, State 3, and State 4 are not anatomical structures. They are recurring activity patterns generated by clustering fMRI time series. That distinction keeps the interpretation honest: the study mapped dynamic configurations of networks, not 4 new depression centers in the brain.
Default-mode network refers to brain regions active during self-referential thought and internal mentation. Frontoparietal network refers to control regions used for attention and task management. Dorsal-attention network supports externally directed attention. Depression research often studies how those systems interact because rumination, anhedonia, and cognitive inflexibility can involve abnormal internal-external switching.
State 3 was interesting because it mixed those systems in a way that related to symptoms. During a resting scan, the brain activity pattern entered this configuration more often, and that pattern tracked symptom severity.
Why Transition Direction Carries Clinical Meaning
Average connectivity can miss direction. A depressed and non-depressed brain might show similar average coupling between 2 networks while moving through those states differently over time. Transition analysis tries to recover that temporal sequence.
The State 4 to State 1 finding is useful because it has a clinically interpretable direction: lower transition probability in MDD, and lower probability aligned with higher distress. That is easier to interpret than a broad statement that connectivity was “altered.”
- Occupancy asks where the signal spends time. State 3 occupancy was higher in MDD.
- Dwell asks how long a visit lasts. State 3 did not behave like a simple longer-stay state.
- Transition asks where the signal goes next. State 4 to State 1 movement was lower in MDD.
- Energy asks how structural wiring constrains movement. Some transitions appeared more costly or less facilitated.
Those layers make the paper more than another static-connectivity result. They also make it harder to translate clinically, because each layer needs replication and each model choice can affect the final state map.
Medication status, illness duration, movement in the scanner, and preprocessing choices can all shift resting-state estimates. Future studies should test whether the same State 3 and State 4 patterns replicate in independent depression cohorts.
Anhedonia Makes the Dynamic-State Result More Clinically Specific
Depression severity is not one symptom. Low mood, anhedonia, rumination, anxiety, sleep disruption, fatigue, psychomotor slowing, appetite change, and suicidal thinking can move differently across patients. A brain-state result tied only to a total score can be difficult to interpret.
State 3 was more useful because the paper connected its dynamics to anhedonia and QIDS severity. Anhedonia is central to many hard-to-treat depression presentations because it reflects loss of reward, interest, and motivated engagement rather than sadness alone.
That connection also fits the transition model. A brain pattern that repeatedly enters reactive or attention-heavy states while failing to use other transitions could plausibly map onto reduced flexibility, rumination, or blunted reward engagement. The study did not prove that causal chain, but it made the symptom link concrete enough to test.
Future work should separate patients by symptom profile before assuming 1 depression signature. A melancholic, anxious-ruminative, anhedonic, and inflammation-linked depression sample may not show the same state-transition pattern.
Treatment studies are the next hard test. If psychotherapy, medication, sleep repair, exercise, or neurostimulation reduces anhedonia, the model should ask whether State 3 occupancy and State 4 to State 1 transition probability move with symptom change. Without that longitudinal step, the current result remains a state marker rather than a treatment target.
That distinction keeps the claim useful without overstating it.
Replication should preserve the directionality. A future paper that only reports “altered dynamic connectivity” would be less useful than one that tests the same occupancy and transition claims directly. The clinically interesting part is not that MDD brains differ in some dynamic way; it is that specific state use and specific state movement tracked symptom burden.
That level of specificity is what could eventually separate a biomarker from a descriptive brain-map result.
Questions About Depression Brain Energy Landscapes
Can this fMRI pattern diagnose depression?
No. The analysis compared groups and symptoms in a research sample. Depression diagnosis still depends on clinical symptoms, duration, impairment, exclusions, and context.
What does State 3 mean clinically?
State 3 is a model-derived brain activity pattern. Clinically, its importance is that higher occupancy and more switching were linked to depression severity and anhedonia measures.
Could this guide brain stimulation?
Eventually, maybe. The study discusses in-silico stimulation logic, but actual treatment targeting would require prospective trials that test whether changing these dynamics improves symptoms.
References
- Kilic O, et al. Spatiotemporal asymmetries on brain energy landscape uncover system entrapment related to depression severity. Nature Communications. 2026. doi:10.1038/s41467-026-71961-4
- Kaiser RH, et al. Large-scale network dysfunction in major depressive disorder: a meta-analysis of resting-state functional connectivity. JAMA Psychiatry. 2015. doi:10.1001/jamapsychiatry.2015.0071
- Gu S, et al. Controllability of structural brain networks. Nature Communications. 2015. doi:10.1038/ncomms9414
- Vidaurre D, et al. Spontaneous cortical activity transiently organizes into frequency specific phase-coupling networks. Nature Communications. 2018. doi:10.1038/s41467-018-05316-z