A 2026 ABCD stop-signal fMRI study found that group-level cognitive-control brain signals often failed to describe within-person brain dynamics: across 16 comparisons, between-person and within-person associations diverged, and several reversed direction.1 The practical warning is narrow but sharp: a brain pattern that separates people in a group may be the wrong map for explaining how control changes inside one person.
Research Highlights
- Group and individual maps split: Mistry et al. analyzed stop-signal task fMRI in N = 4,423 ABCD youth for go reaction time, stop-signal reaction time, and proactivity probability, plus N = 4,137 for proactive delaying.1
- Nonergodicity was pervasive: all 16 between-person vs. within-person comparisons diverged across 1 observed reaction-time measure, 1 latent reactive-control measure, and 2 latent proactive-control measures.1
- Some signals reversed direction: proactive delaying was positive across all networks between subjects, but predominantly negative within subjects in salience and frontoparietal networks, with network tests at PFDR < 0.01.1
- Reactive and proactive control separated: SSRT-to-proactivity representation similarity ranged from −0.07 to 0.06, while the 2 proactive measures clustered at 0.61 to 0.67.1
- Individualized claims need within-person evidence: psychiatric-neuroimaging papers now distinguish population, cohort, and individualized designs because group biomarkers do not automatically explain 1 person’s symptom dynamics or treatment response.2
Nonergodicity means a pattern measured across people does not equal the pattern operating within the same person over time. In cognitive neuroscience, that distinction matters because many fMRI studies correlate average brain activation with average behavior across participants, then slide into language about mechanisms inside individuals.
Simpson’s paradox is one visible form of that failure: an association can point one way at the group level and the opposite way inside individuals. The familiar behavioral example is speed and accuracy. Faster people may be more accurate than slower people across a sample, while the same person usually becomes less accurate when rushing.
4,423 ABCD Youth Showed Group vs. Individual fMRI Divergence
Mistry et al. used baseline data from the Adolescent Brain Cognitive Development study, a large U.S. cohort of children recruited at age 9-10 years.1 After quality exclusions, the fMRI analyses included 4,423 youth for go reaction time, stop-signal reaction time, and probability of proactivity; proactive delaying used 4,137 youth because 286 participants lacked enough proactive trials for that parameter.
The stop-signal task measures inhibitory control by asking participants to respond quickly to ordinary “go” cues while canceling the response when a stop cue appears. In this study, each participant completed 360 trials: 300 go trials and 60 stop trials.
Stop-signal reaction time (SSRT) estimates how long the stopping process takes. Shorter SSRT generally means faster response inhibition. Mistry et al. also modeled proactive control, which means preparing in advance to slow or adjust behavior when a stop signal might appear.
The technical move was the PRAD model, a hierarchical Bayesian model that estimated trial-level cognitive-control quantities instead of treating each child as one averaged score. It produced trial-level SSRT, probability of proactivity, and proactive delaying. That let the researchers compare 2 different questions:
- Between-subjects question: do children with higher average activation also show different average behavior?
- Within-subjects question: when the same child’s control process fluctuates across trials, does brain activity fluctuate with it?
Those questions are not interchangeable. Between-subjects fMRI describes stable differences among people. Within-subjects fMRI describes dynamic coupling inside a person across time.
Proactive Delaying Reversed Across Levels of Analysis
The clearest reader-facing result was proactive delaying. Between subjects, proactive delaying showed positive correlations with brain activity in all tested networks, all PFDR < 0.01. In ordinary language, children who used more proactive delaying also tended to show higher average activation during successful stopping.
Within subjects, the direction changed. Trial-level proactive delaying was predominantly negative in salience and frontoparietal networks, again with corrected network tests at PFDR < 0.01. When an individual child delayed more proactively on a trial-by-trial basis, the brain-behavior relation did not look like the group-average relation.
Salience networks help detect behaviorally relevant events and allocate control. Frontoparietal networks help maintain and adjust goal-directed behavior. A reversal in those systems is not a tiny technical wrinkle; it changes how a cognitive-control mechanism would be interpreted.
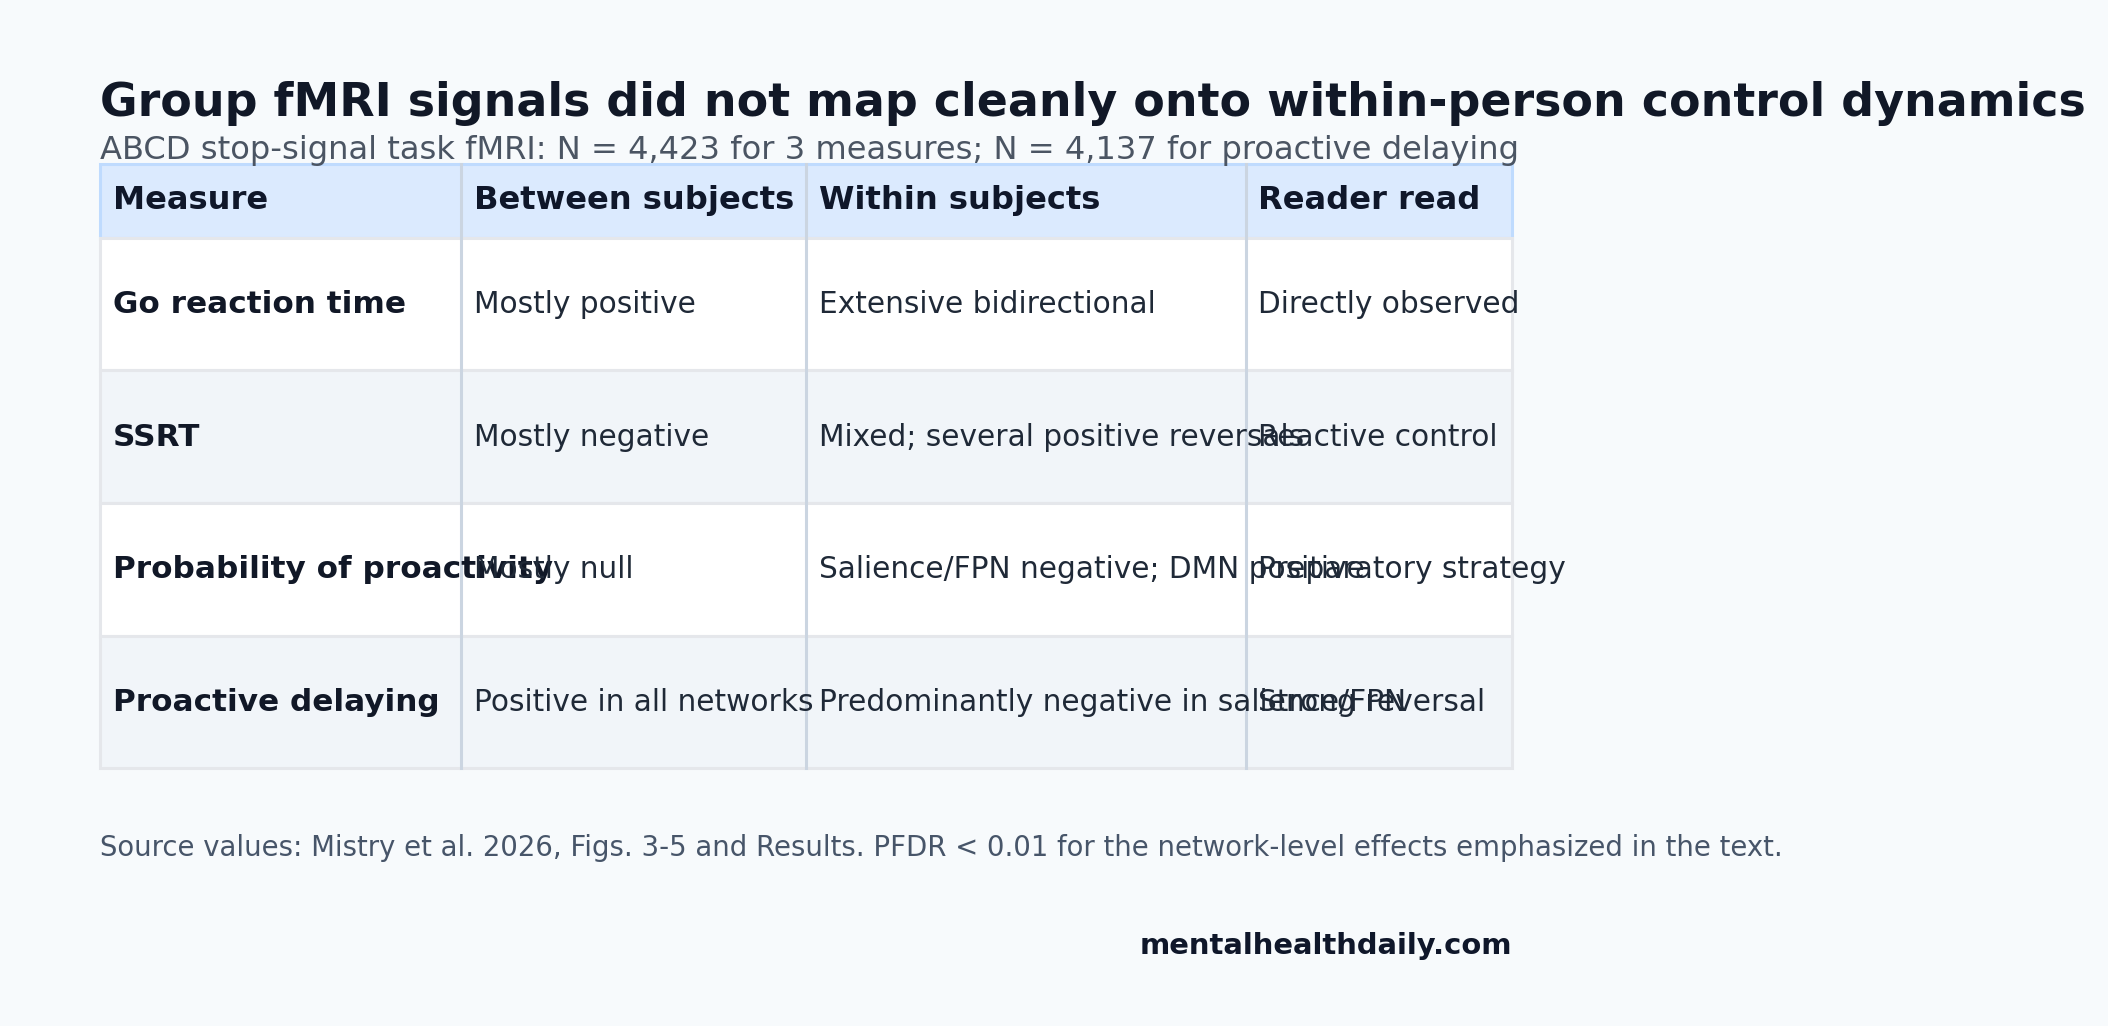
SSRT showed the same general problem. Between subjects, SSRT had negative correlations in most networks, with effects in posterior salience, frontoparietal, and default mode networks. Within subjects, SSRT showed mixed negative and positive associations, including opposite positive associations in posterior salience, precuneus, visuospatial, auditory, and sensorimotor networks, all PFDR < 0.01.
Probability of proactivity was subtler but still nonergodic. Between subjects, it had no significant network correlations except a negative association in the language network. Within subjects, it showed negative associations in salience and frontoparietal networks and positive associations in default mode regions, all PFDR < 0.01.
Reactive and Proactive Control Had Different Neural Representations
After showing that group and individual maps diverged, the researchers asked whether reactive and proactive control were represented similarly inside the brain. Representational similarity analysis compares patterns of brain activity to ask whether 2 mental processes use similar neural maps.
Reactive control and proactive control looked largely separate. Across networks, median similarity between SSRT and probability of proactivity, or between SSRT and proactive delaying, ranged from −0.07 to 0.06. Those values sit close to zero.
The 2 proactive measures clustered together. Probability of proactivity and proactive delaying had median correlations from 0.61 to 0.67 across networks. All 3 similarity comparisons differed after correction, all PFDR < 0.01.
The result fits a useful cognitive distinction. Reactive control is the late canceling process: stop the response now. Proactive control is preparatory: slow down or adjust strategy because stopping may be needed soon. The fMRI patterns suggest those control modes were separable brain states.
Adaptive Strategy Subgroups Changed the Brain-Behavior Pattern
Mistry et al. also used the model to separate children by cognitive-control strategy. The reactivity subgroup analysis compared children whose stopping expectancy changed in an adaptive vs. maladaptive direction. That split produced gamma1 < 0 for 2,487 children and gamma1 > 0 for 1,936 children.
Within-subject SSRT associations differed between those reactivity subgroups in every examined network, all PFDR < 0.01. In half the networks, SSRT even had opposite association directions between the 2 strategy groups.
The proactivity subgroup analysis used theta1. Children with adaptive proactivity regulation had theta1 < 0, N = 3,018. Children with maladaptive proactivity regulation had theta1 > 0, N = 1,405. The adaptive group generally showed more negative coupling between probability of proactivity and brain activity, especially in the anterior salience network.
Evidence-strength note: these are strategy-linked fMRI associations in 9- to 10-year-old children, not clinical subtypes. They support the idea that individual cognitive strategies shape brain-behavior coupling, but they do not diagnose attention-deficit/hyperactivity disorder, predict treatment response, or prove that changing a network would improve behavior.
Psychiatric Biomarkers Cannot Borrow Group Logic Automatically
The psychiatric relevance is methodological rather than diagnostic. Meyer-Lindenberg argued that mental-health and psychiatric disorders are nonergodic enough that group-level biomarkers can miss the mechanisms driving one person’s symptoms over time.3 Gell et al. made a similar design distinction for psychiatric neuroimaging: individualized, cohort, and population studies answer different questions and should not be sold as the same evidence surface.2
Mistry et al. give that warning a concrete cognitive-control example. A group-level fMRI association may still be useful for population description, risk enrichment, or broad developmental mapping. It becomes weaker when the claim shifts to within-person mechanisms, symptom fluctuation, or personalized intervention targeting.
That boundary is especially important for cognitive-control problems in ADHD, addiction, obsessive-compulsive symptoms, depression, and psychosis. Inhibitory-control circuits are often invoked as treatment targets, but a target chosen from between-person differences may not be the target driving moment-to-moment control failures in a specific person.
Bissett and Poldrack had already shown that ABCD stop-signal data require careful design handling before strong inference.4 Mistry et al. add a second layer: even after modeling the task carefully, the level of analysis still determines what kind of claim the data can support.
For treatment research, trials need designs that measure change inside people alongside baseline differences between people. Otherwise a biomarker can look precise while answering the wrong clinical question.
Questions About Cognitive-Control fMRI and Nonergodicity
Does this mean group fMRI studies are useless?
No. Group fMRI can describe population-level patterns, developmental differences, and broad associations. The problem starts when a group-level association is treated as proof of a mechanism inside each individual.
What was the strongest reversal in the study?
Proactive delaying was positive across all tested networks between subjects, but predominantly negative within subjects in salience and frontoparietal networks. It is the most direct example of group-level inference pointing away from within-person dynamics.
Can this study guide personalized treatment?
Not directly. It was a task-fMRI and modeling study in ABCD youth, not a treatment trial. It says personalized treatment claims need within-person or individual-level designs before borrowing cognitive-control brain markers.
Why use children rather than adults?
ABCD provides a very large developmental fMRI sample with stop-signal task data. The tradeoff is scope: the results are strongest for cognitive-control dynamics in 9- to 10-year-old youth, not for all adult psychiatric populations.
References
- Mistry PK, Branigan NK, Gao Z, Cai W, Menon V. Nonergodicity and Simpson’s paradox in neurocognitive dynamics of cognitive control. Nature Communications. 2026;17:3494. doi:10.1038/s41467-026-71404-0
- Gell M, Noble S, Laumann TO, Nelson SM, Tervo-Clemmens B. Psychiatric neuroimaging designs for individualised, cohort, and population studies. Neuropsychopharmacology. 2025;50:29-36. PubMed
- Meyer-Lindenberg A. The non-ergodic nature of mental health and psychiatric disorders: implications for biomarker and diagnostic research. World Psychiatry. 2023;22:272-274. doi:10.1002/wps.21077
- Bissett PG, Hagen MP, Jones HM, Poldrack RA. Design issues and solutions for stop-signal data from the Adolescent Brain Cognitive Development (ABCD) study. eLife. 2021;10:e60185. doi:10.7554/elife.60185
- Mattoni M, Fisher AJ, Gates KM, Chein J, Olino TM. Group-to-individual generalizability and individual-level inferences in cognitive neuroscience. Neuroscience & Biobehavioral Reviews. 2025;169:106024. PubMed
- Aron AR. From reactive to proactive and selective control: developing a richer model for stopping inappropriate responses. Biological Psychiatry. 2011;69:e55-e68. PubMed