
A 2026 quantitative MRI preprint reanalyzed 138 healthy adults and found that multivariate modeling detected coordinated age-related shifts across myelin-sensitive, iron-sensitive, and water-sensitive brain maps.1 The signal was broad, but split-half validation weakened the result enough to keep it in the measurement-method lane rather than the clinical-test lane.
Research Highlights
- 138 adults were reanalyzed: The dataset included healthy participants aged 19-75 years, with mean age 46.64 years and 35.5% male representation.1
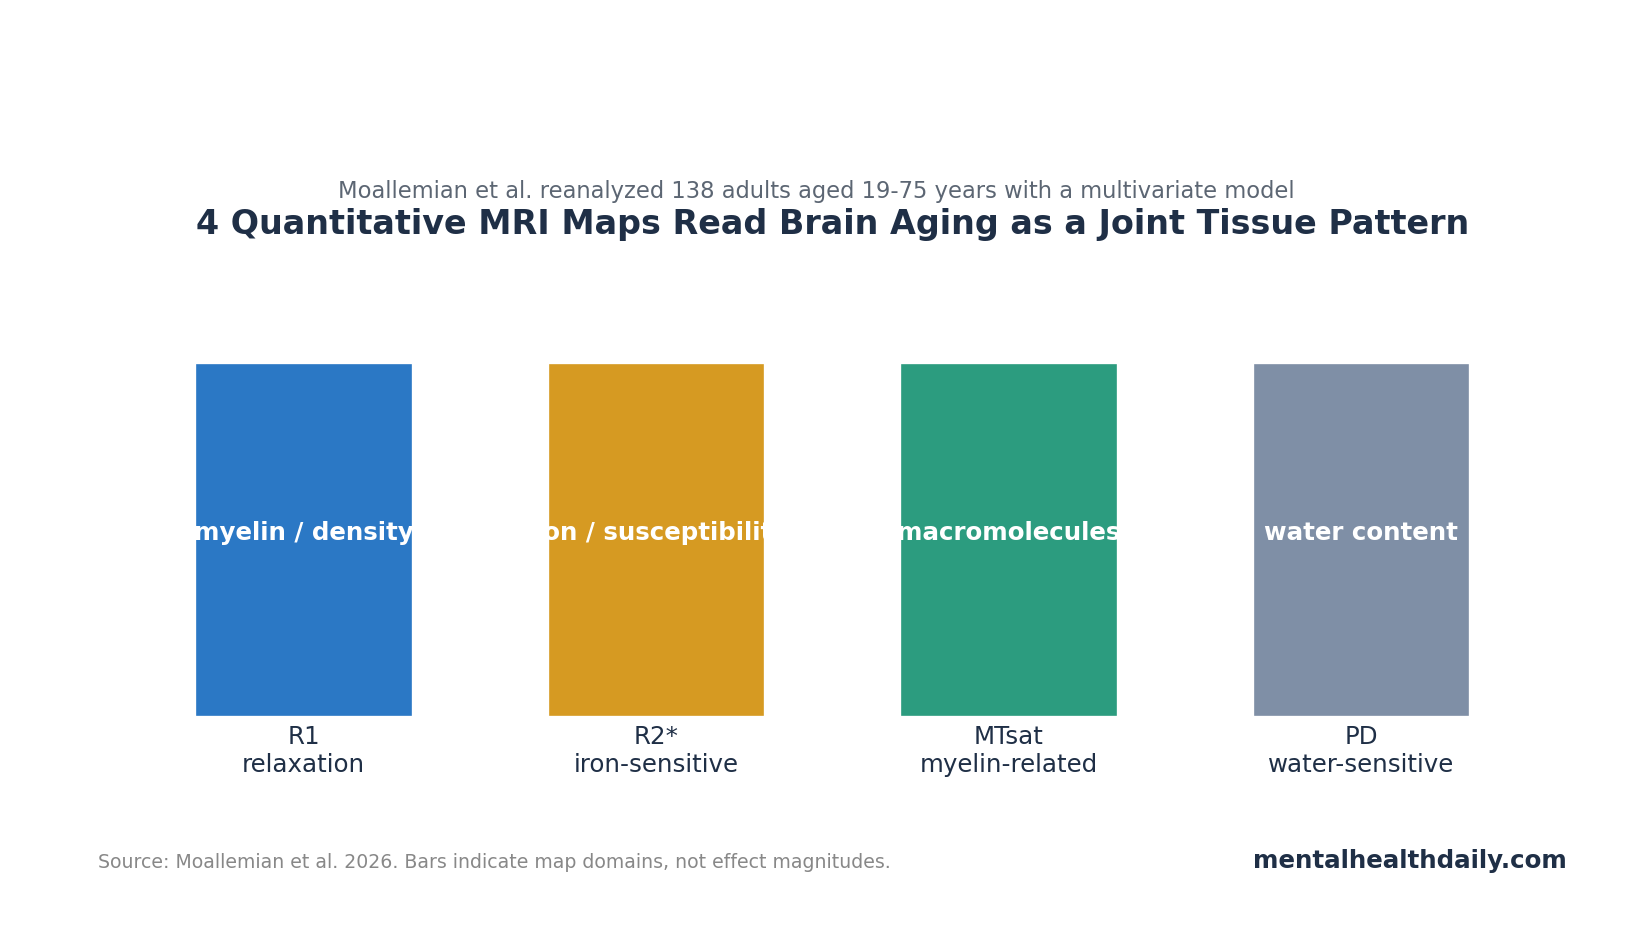
- 4 qMRI maps were combined: R1, R2*, magnetization transfer saturation, and proton-density maps were analyzed across gray and white matter to capture tissue properties jointly.1
- Multivariate maps widened the aging signal: Coordinated age associations appeared in regions including caudate, putamen, insula, hippocampus, cerebellum, lingual gyri, and olfactory bulb.1
- Agreement was good, not perfect: Kappa values comparing multivariate and union-univariate maps ranged from 0.6599 to 0.7292 across gray and white matter thresholds.1
- Robustness stayed conditional: Split-half validation reduced sensitivity for all models and especially challenged the multivariate signal at the less conservative threshold.1
Quantitative MRI (qMRI) measures physical tissue properties rather than relying only on conventional image brightness. In this study, R1 indexed longitudinal relaxation, R2* was sensitive to iron and magnetic susceptibility, magnetization transfer saturation reflected macromolecular and myelin-related signal, and proton density captured water-related tissue content.
Multivariate analysis asks whether several measurements move together. In aging research, that joint model helps because myelin loss, iron accumulation, water shifts, and tissue remodeling occur as overlapping tissue processes.
Multivariate qMRI Revisited a 138-Person Aging Dataset
Moallemian et al. used processed data from an earlier quantitative MRI aging project involving 138 healthy adults aged 19-75 years.1 The original Callaghan et al. analysis had already shown widespread age-related microstructural differences with quantitative MRI.2 The 2026 preprint asked a narrower method question: does combining maps inside one model reveal age-related tissue patterns that univariate map-by-map testing misses?
The researchers analyzed 4 parameter maps in 2 tissue classes:
- R1: a relaxation measure often linked to myelin and tissue density.
- R2*: a measure influenced by iron, deoxygenated blood, and local magnetic susceptibility.
- MTsat: magnetization transfer saturation, a marker related to macromolecules and myelin-rich tissue.
- PD: proton density, a water-content-sensitive signal.
The model adjusted for age, total intracranial volume, gender, and scanner. That design matters because a multivariate map could otherwise mistake scanner or head-size effects for biology.
Age-Related Differences Appeared Across Deep Gray, Limbic, and Cerebellar Regions
The multivariate model detected bidirectional correlations between age and the MRI maps in several regions: caudate nucleus, putamen, insula, cerebellum, lingual gyri, hippocampus, and olfactory bulb.1 In plain language, older age was not tied to one simple global direction. Different tissue parameters contributed differently by region.
Deep-gray signal: caudate and putamen findings fit a broader aging literature in which basal-ganglia tissue properties, including iron-sensitive measures, change with age and can relate to cognition or movement vulnerability.4
Limbic signal: hippocampal and parahippocampal involvement makes biological sense because medial temporal regions sit near the intersection of normal aging, memory vulnerability, and neurodegenerative risk.
Cerebellar signal: cerebellar aging is often underweighted in public discussions of brain aging, but qMRI and structural imaging repeatedly show that cerebellar tissue properties change with age rather than acting as a preserved control region.
Multivariate Sensitivity Came With a Robustness Warning
Compared with individual univariate models and the union of those models, the multivariate model identified larger spatial extents in regions including supplementary motor area, frontal cortex, hippocampus, amygdala, occipital cortex, and cerebellum.1 The comparison is not a simple win-loss result. Multivariate models can gain sensitivity by using covariance across measures, but that same sensitivity can make robustness testing more important.
The map agreement values support that calibrated read. Kappa ranged from 0.6599 to 0.7292 when comparing multivariate maps with union-univariate maps across gray and white matter thresholds, a level the researchers interpreted as good agreement.1
Split-half validation then reduced significant voxel and cluster counts. Sensitivity fell for every model because each split had fewer people, but the reduction was more pronounced for the multivariate model at the p < .05 family-wise-error threshold.
Myelin, Iron, and Water Should Be Read Together
Brain aging is easier to misread when each tissue property is interpreted alone. Lower myelin-sensitive signal can reflect demyelination or remodeling. Higher iron-sensitive signal can reflect iron deposition, vascular change, or local susceptibility effects. Proton-density shifts can reflect water content and tissue organization.
The 2026 analysis supports a joint-reading model:
- Myelin-related signal: white-matter and gray-matter myelin changes are part of normal aging and neurodegenerative vulnerability.
- Iron-related signal: deep-gray and cortical iron patterns may interact with oxidative stress and cognitive aging.
- Water-related signal: proton-density changes may capture tissue composition and microstructural looseness that standard images compress into nonspecific brightness.
That combined model matches prior voxel-based qMRI work in normal aging and newer quantitative synthetic MRI studies that track relaxation, proton density, myelin, and volume together.3,5
This Is a Measurement Advance, Not a Brain-Age Test
Evidence-strength note: this was a preprint reanalysis, not a new clinical cohort and not a diagnostic validation study. It can show that multivariate qMRI may detect coordinated aging-related tissue signatures. It cannot show that a single person has accelerated brain aging, dementia risk, or treatment response.
Several limits keep the conclusion narrow:
- Existing dataset: the 2026 paper reused a previously published dataset, which is useful for method comparison but less independent than a new acquisition.
- Healthy sample: findings in healthy adults do not automatically transfer to Alzheimer disease, Parkinson disease, multiple sclerosis, or depression.
- Split-half weakness: reduced sensitivity after splitting the sample argues for larger datasets before using the map pattern as a stable biomarker.
- Preprint status: peer review and external replication remain necessary.
Scanner, Head Size, and Covariance Are Not Minor Details
The useful part of this qMRI analysis is that it treats measurement as biology only after accounting for obvious technical confounds. Scanner, total intracranial volume, gender, and age were included in the model because each can change the apparent tissue-property map without representing the microstructural process a reader actually cares about.1
Total intracranial volume is the overall head-size measure used to avoid mistaking larger or smaller brains for tissue-property differences. In aging studies, that adjustment is especially important because regional tissue loss, cohort differences in head size, and scanner-dependent contrast can otherwise pile into the same statistical map.
Covariance is the main reason to use the multivariate model: R1, R2*, MTsat, and proton density are not independent biological worlds. A region with lower myelin-sensitive signal may also have different water content or iron-sensitive signal. Testing the maps together asks whether a coordinated pattern exists across measures, while separate univariate tests ask whether each map clears its own threshold alone.
That distinction explains why the result should be read as a measurement advance rather than a simple larger-map victory. More spatial extent is useful only when the extra signal survives calibration, split-half checks, and scanner-generalization tests. The 2026 paper moved the field toward that joint-reading model, but it also showed why larger longitudinal qMRI datasets are needed before multivariate maps become individual-level risk tools.
A practical replication would need the same person scanned across time or the same protocol repeated across sites. Cross-sectional age differences can identify candidate tissue patterns, but they cannot say whether one individual’s caudate, hippocampus, or cerebellum is changing quickly. Longitudinal designs would also show whether the multivariate signal tracks cognition, gait, smell, memory, or another outcome rather than only age.
The region list should stay biologically modest: caudate, putamen, hippocampus, cerebellum, lingual gyri, insula, and olfactory bulb all have plausible aging relevance, but the paper did not test a disease-specific pathway for each one. The stronger claim is pattern detection across tissue-sensitive maps. The weaker claim, which the article should avoid, is that every named region has a settled clinical meaning.
For readers comparing this with commercial brain-age products, the difference is important. A brain-age product usually compresses scans into one age-like score. This qMRI work keeps the tissue channels visible. That makes it less flashy, but more scientifically useful: myelin-sensitive, iron-sensitive, and water-sensitive signals can disagree, and those disagreements may be where the biology sits.
The bottom-line metric is not one number: the paper’s kappa agreement values, region maps, and split-half sensitivity all have to be read together. Good agreement with union-univariate maps supports the method, while the split-half drop shows the current sample is still too small for clinical confidence.
That combination is the calibrated answer: multivariate qMRI is promising because it can detect coordinated tissue-property aging, and it remains preliminary because scanner-stable, longitudinal, outcome-linked replication has not yet done the harder validation work.
Questions About qMRI Brain Aging Maps
Does qMRI diagnose brain aging?
No. qMRI measures tissue properties that change with age. Diagnosis would require validated individual-level thresholds, clinical outcomes, and replication across scanners.
Why combine myelin, iron, and water maps?
These tissue properties interact. A region can show age-related remodeling across several biological dimensions, and a multivariate model can detect that coordinated pattern better than separate one-map tests.
What should happen next?
Larger longitudinal qMRI datasets should test whether multivariate tissue-property trajectories predict cognition, motor decline, neurodegenerative conversion, or treatment-sensitive aging signals.
References
- Moallemian S, Bastin C, Callaghan MF, Phillips C. Multivariate age-related variations in quantitative MRI maps: widespread age-related differences revisited. medRxiv. 2026. doi:10.1101/2023.10.19.23297253
- Callaghan MF, Freund P, Draganski B, et al. Widespread age-related differences in the human brain microstructure revealed by quantitative magnetic resonance imaging. Neurobiology of Aging. 2014;35(8):1862-1872. doi:10.1016/j.neurobiolaging.2014.02.008
- Draganski B, Ashburner J, Hutton C, et al. Regional specificity of MRI contrast parameter changes in normal ageing revealed by voxel-based quantification. NeuroImage. 2011;55(4):1423-1434. doi:10.1016/j.neuroimage.2011.01.052
- Khattar N, Triebswetter C, Kiely M, Ferrucci L, Resnick SM, Spencer RG, Bouhrara M. Investigation of the association between cerebral iron content and myelin content in normative aging using quantitative magnetic resonance neuroimaging. NeuroImage. 2021;239:118267. doi:10.1016/j.neuroimage.2021.118267
- Hagiwara A, Fujimoto K, Kamagata K, et al. Age-related changes in relaxation times, proton density, myelin, and tissue volumes in adult brain analyzed by 2-dimensional quantitative synthetic magnetic resonance imaging. Investigative Radiology. 2021;56(3):163-172. doi:10.1097/rli.0000000000000720