
A 2026 Clinical Epigenetics study tracked DNA methylation biological age in 894 older adults and found that each 1-SD higher biological-age slope predicted 17-28% higher all-cause mortality risk across 5 epigenetic clocks.1 The clocks moved more slowly than calendar time over 8.1 years, but participants with higher methylation-age slopes had worse survival than participants with lower slopes.
Research Highlights
- 894 older adults were followed: ESTHER participants were aged 50-75 years at baseline and had DNA methylation data at baseline and 8-year follow-up.1
- Mean follow-up was 8.1 years: The blood-sampling interval ranged from 6.9 to 10.5 years, and 299 deaths occurred during subsequent follow-up.1
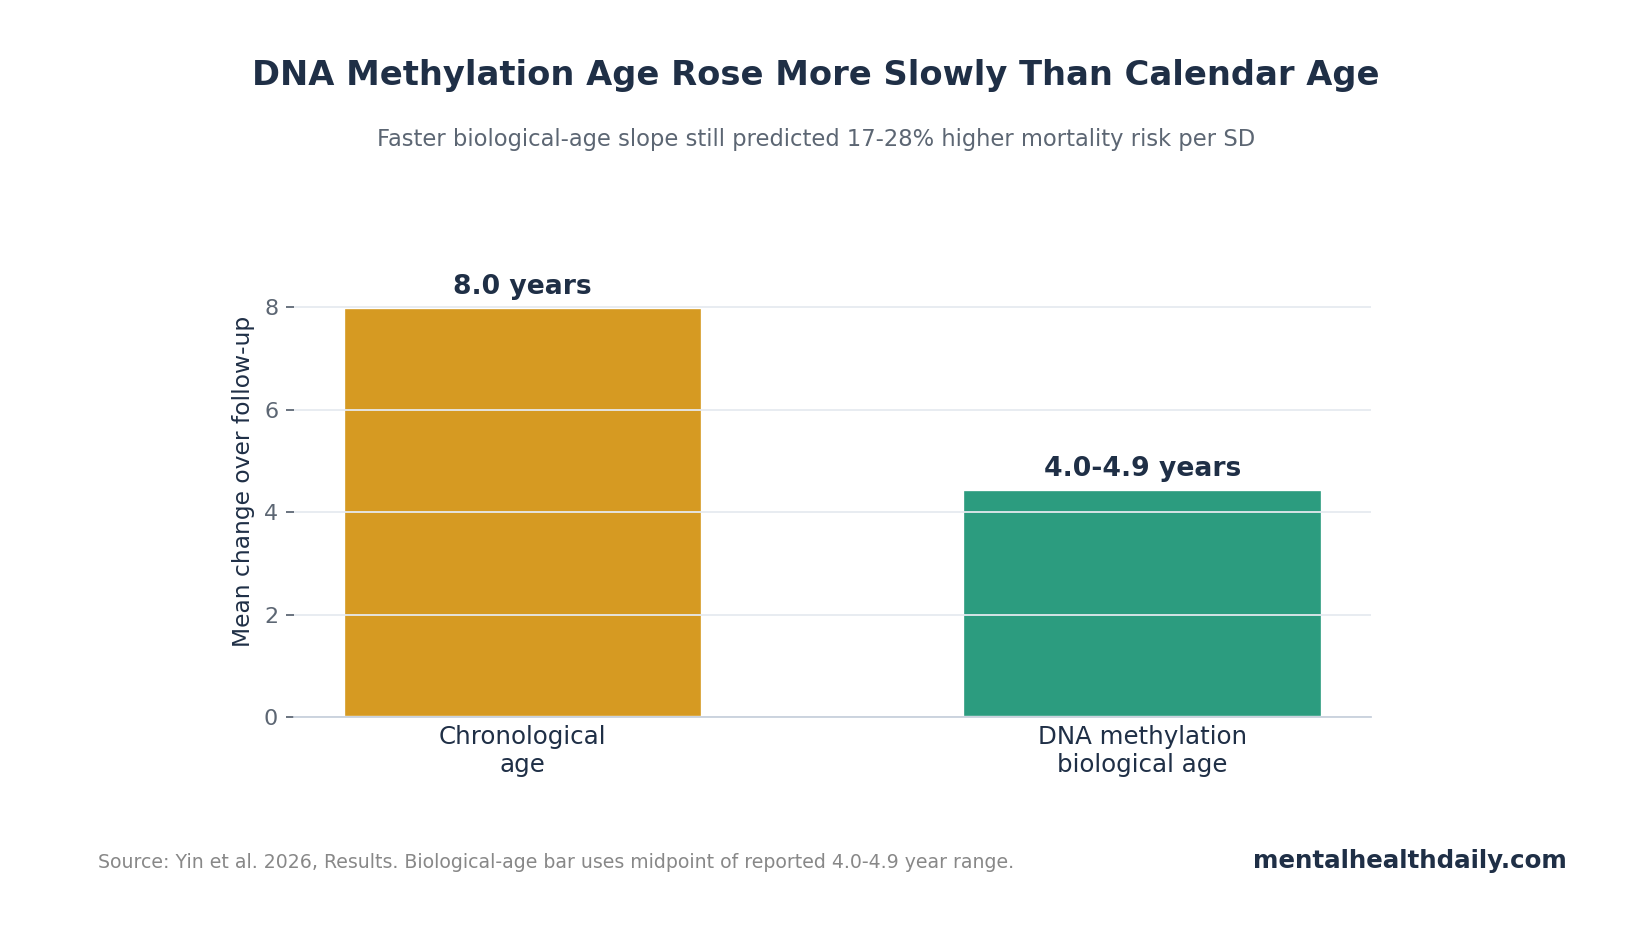
- Biological age rose slower than chronological age: Across 5 principal-component clocks, mean biological age increased 4.0-4.9 years over the 8-year interval.1
- Mortality tracked the slope: A 1-SD higher biological-age slope was associated with 17-28% higher all-cause mortality risk across clocks.1
- Lifestyle factors still mattered: Smoking, physical activity, and alcohol consumption were major determinants of individual biological-age trajectories.1
DNA methylation is a chemical marking system on DNA that helps regulate gene activity without changing the genetic code. Epigenetic clocks use methylation patterns at many DNA sites to estimate biological age, a risk-linked aging signal that can differ from chronological age.
Biological-age clocks are attractive because they compress many exposures and physiological stresses into one number. They are also easy to oversell: a clock reading is not a guarantee of lifespan, and a better clock score does not automatically mean someone has become biologically younger in a clinically meaningful way.
894 ESTHER Participants Had 2 DNA Methylation Timepoints
Yin et al. analyzed data from the German ESTHER cohort. The final sample included 894 participants with baseline and 8-year follow-up blood DNA methylation data after quality control.1 Mean chronological age was 61.2 years at baseline and 69.2 years at follow-up. Women accounted for 55.4% of the cohort, and 13.1% had at least 12 years of schooling.
The study used 5 principal-component DNA methylation clocks: PCHorvath, PCSkinBloodClock, PCHannum, PCPhenoAge, and PCGrimAge. Principal-component clocks reduce technical noise by summarizing methylation sites into stable components before calculating age.
Biological Age Increased 4.0-4.9 Years Over an 8-Year Calendar Interval
The average interval between blood methylation measurements was 8.1 years, with a range of 6.9-10.5 years. Over that period, biological age increased more slowly than chronological age: changes across the 5 clocks ranged from 4.0 to 4.9 years.1
Those values describe clock calibration rather than rejuvenation. These specific clock estimates moved less than one-to-one with calendar age in late middle age and older adulthood because some clocks are designed to track mortality risk, healthspan, or blood-based aging biology instead of pure elapsed time.
Clock calibration: all biological-age estimates correlated moderately to strongly with chronological age at baseline, with r = 0.67-0.78. PCHorvath and PCHannum were especially correlated with each other, r = 0.96.
Faster Biological-Age Slope Predicted Death Risk
The key outcome was not the baseline clock value alone. The researchers calculated biological-age slope, meaning the change in biological age divided by the time between measurements. They standardized slopes so each hazard ratio represented a 1-SD faster biological-aging trajectory.
During subsequent follow-up, 299 deaths occurred. In univariate and fully adjusted Cox models, all 5 PC-based clocks showed significant associations with increased mortality in the total population. A 1-SD higher biological-age slope was associated with 17-28% higher mortality risk.1
Mortality interpretation: the slope appears to be a risk marker. Participants with higher methylation-age trajectories had higher death risk than participants with lower trajectories even after adjustment for sex, education, smoking, body mass index, physical activity, and alcohol consumption.
Smoking Had One of the Clearest Clock Signals
Baseline characteristics tracked clock values. Current smoking was associated with older baseline biological age across several clocks, including PCGrimAge, where current smokers were 5.74 years higher than never smokers in the adjusted baseline model.1
Smoking also tracked faster biological-age slope. The slope analysis reported current-smoking beta values around 0.16-0.23 for several PC-clock slopes, indicating faster methylation-aging trajectories among current smokers.1
Physical activity and alcohol associations were more clock- and sex-dependent. The useful point is not that one behavior maps perfectly onto one clock. It is that methylation clocks remain sensitive to real-life exposures rather than operating as fixed genetic destiny.
Biological-Age Clocks Are Risk Markers, Not Anti-Aging Receipts
Foundational clock work showed that DNA methylation age can be estimated across tissues, while later clocks such as PhenoAge and GrimAge were built to capture healthspan, mortality, and physiology more directly.2,3,4 Yin et al. extend that line by focusing on repeated measurement and slope.
Evidence-strength note: this was an observational cohort analysis. It can show that faster methylation-age slope predicts mortality. It cannot prove that changing a clock score through supplements, exercise, fasting, drugs, or commercial “rejuvenation” programs will reduce death risk.
Several limits matter:
- Survivor structure: mortality analysis included people alive at 8-year follow-up, because slope required 2 measurements.
- Blood-based clocks: blood methylation may not mirror brain, muscle, liver, or immune aging one-to-one.
- Clock differences: Horvath, Hannum, PhenoAge, and GrimAge families were built with different targets, so disagreement is expected.
- Behavioral causality: smoking and physical activity associations do not prove that changing behavior will normalize every clock slope.
Repeated Measurement Is the Main Upgrade Over One-Time Clock Scores
A single biological-age value is hard to interpret because it mixes long-standing exposure history, measurement noise, cell-type composition, and the clock’s design target. Yin et al. added a second blood draw after a mean 8.1 years, which let the researchers estimate slope rather than only baseline age acceleration.1
Baseline level and slope answer different questions: baseline biological age asks whether a person already looks older or younger than expected at one moment. Slope asks whether the methylation-age trajectory is moving faster or slower over time. A person can start high and then slow down, or start average and then accelerate.
PC clocks were chosen for reliability: principal-component versions of Horvath, Hannum, PhenoAge, GrimAge, and SkinBlood clocks are designed to reduce technical noise by summarizing methylation information into more stable components. That matters because slope analyses amplify error: subtracting 2 noisy measures can create a false trajectory.
The mortality finding is stronger because it used change: 299 deaths after the second measurement gave the study enough outcome events to ask whether faster methylation aging carried risk beyond ordinary chronological aging and measured lifestyle factors. The answer was yes at the cohort level, with 17-28% higher all-cause mortality risk per 1-SD faster slope.
Commercial biological-age tests often imply that a lower number is inherently better, but longitudinal cohort data are more cautious. A clock can move less than calendar age because of how it was trained, because blood-cell composition changed, or because the biology it captures is not a literal stopwatch. The ESTHER analysis is useful precisely because it ties slope to mortality rather than treating the clock as self-validating.
The next evidentiary step is intervention-linked trajectory work: measure baseline clock levels, change diet, smoking, exercise, medication, or inflammation in a controlled way, repeat methylation testing, and track clinical outcomes. Without that chain, a better slope remains a risk marker. It may guide hypotheses, but it does not prove that a purchased age-reversal program changed survival odds.
Sex-specific and clock-specific differences should also stay visible. A determinant that moves PCGrimAge may not move PCHorvath, and a factor associated with men’s slopes may not behave the same way in women. Treating all epigenetic clocks as interchangeable hides the reason the study tested 5 clocks rather than one.
Mortality follow-up gives the slope clinical weight: the study did not stop at showing that methylation clocks changed over time. It connected faster slope with subsequent all-cause mortality after adjustment for major measured factors. That outcome link is why the slope deserves attention beyond technical clock performance.
The caution is survivor selection. Participants needed 2 methylation timepoints to enter the slope analysis, so the frailest people who died before follow-up were not represented in the same way. That does not erase the mortality association, but it keeps the estimate anchored to community-dwelling older adults who survived long enough for repeat blood sampling.
Clinical use would need calibration: a 1-SD faster slope is meaningful in a cohort model, but it is not a bedside threshold. Before a clinician could act on a methylation-age slope, the field would need reference ranges, assay reproducibility, decision thresholds, and proof that changing the slope changes outcomes.
That is why the study is strongest as risk-marker evidence. It supports repeated methylation clocks as a way to study aging biology in populations, while leaving individual anti-aging claims and consumer test interpretation outside the evidence.
Questions About DNA Methylation Biological Age
Is biological age better than chronological age?
It answers a different question. Chronological age measures elapsed time. DNA methylation biological age estimates risk-linked molecular aging patterns that vary among people of the same chronological age.
Does a faster clock slope mean someone will die soon?
No. The study reports population-level risk. A 17-28% higher hazard per standard deviation is meaningful statistically, but it is not an individual prediction date.
Can lifestyle slow DNA methylation aging?
Smoking, physical activity, and alcohol patterns were associated with clock levels and slopes in this cohort. Interventional proof requires trials that change behavior and then show durable clock and clinical-outcome improvement.
References
- Yin Q, Schottker B, Holleczek B, Fan Z, Stevenson-Hoare J, Brenner H. Tracking DNA methylation-based biological age over 8 years and its association with mortality in community-dwelling older adults. Clinical Epigenetics. 2026;18:65. doi:10.1186/s13148-026-02067-3
- Horvath S. DNA methylation age of human tissues and cell types. Genome Biology. 2013;14:R115. doi:10.1186/gb-2013-14-10-r115
- Levine ME, Lu AT, Quach A, et al. An epigenetic biomarker of aging for lifespan and healthspan. Aging. 2018;10(4):573-591. doi:10.18632/aging.101414
- Lu AT, Quach A, Wilson JG, et al. DNA methylation GrimAge strongly predicts lifespan and healthspan. Aging. 2019;11(2):303-327. doi:10.18632/aging.101684
- Higgins-Chen AT, Thrush KL, Wang Y, et al. A computational solution for bolstering reliability of epigenetic clocks: implications for clinical trials and longitudinal tracking. Nature Aging. 2022;2(7):644-661. doi:10.1038/s43587-022-00248-2