
Whether alcohol, cocaine, nicotine, and cannabis damage the same brain regions or different brain regions has been hard to settle in the addiction-imaging literature. A 2026 ENIGMA Addiction analysis by Georgiadis et al. — pooling 4,733 brains across 51 sites — now has an answer.
Research Highlights
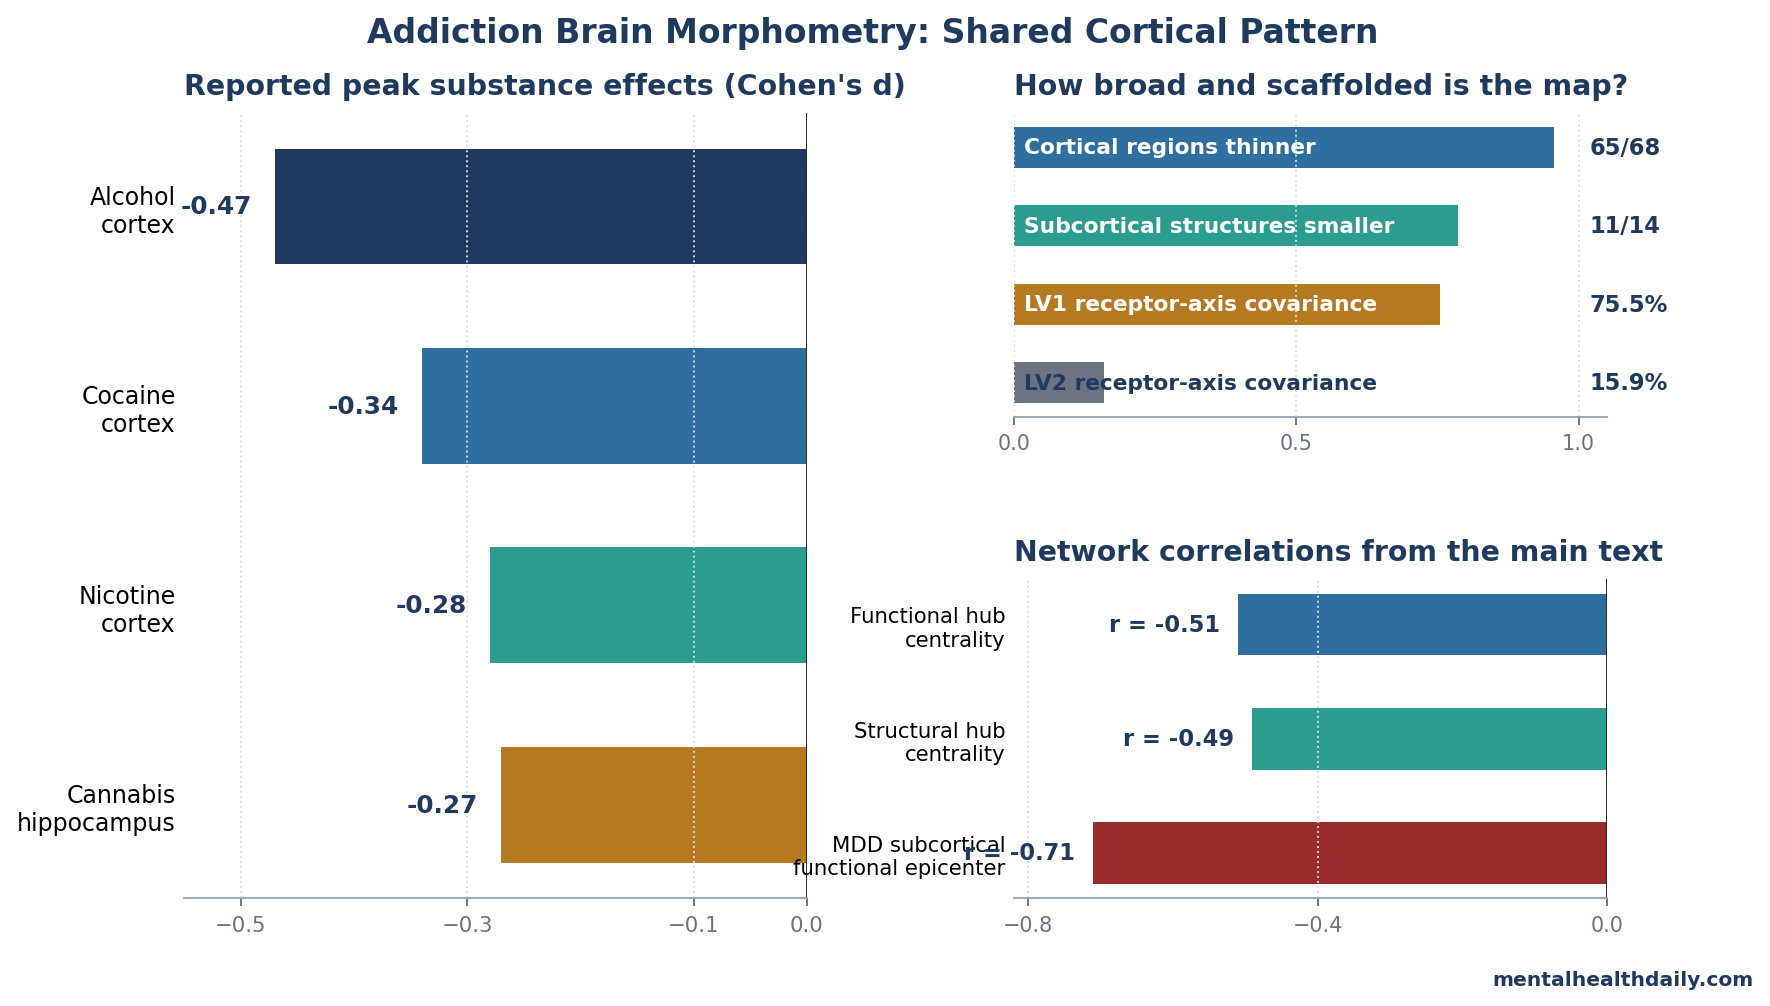
- Across 2,782 people with substance use disorder (SUD) and 1,951 controls in the ENIGMA Addiction Working Group, 65 of 68 cortical regions showed lower thickness — the broadest single mapping of addiction-related cortical morphometry to date.1
- Effect sizes were ranked by substance: alcohol largest (peak Cohen’s d −0.47), cocaine next (−0.34), nicotine moderate (−0.28), cannabis circumscribed and limbic-predominant (hippocampus −0.27), amphetamines and opioids did not survive correction because those substance-specific samples were smaller than the alcohol, cocaine, nicotine, and cannabis samples.1
- The morphometric pattern follows network hub vulnerability. Highly connected cortical hubs were preferentially thinned (functional centrality r = −0.51, pspin = 0.002), the same principle previously documented in schizophrenia and Alzheimer’s disease.1
- SUD epicenters spatially overlap with schizophrenia and bipolar disorder (r = 0.55–0.87 across modalities), suggesting shared network-constrained vulnerability rather than substance-specific damage.1
- Two neurotransmitter axes shape the cortical pattern: LV1 explained 75.5% of cross-covariance and loaded on CB1, KOR, MOR, mGluR5, and H3 receptor density; LV2 explained 15.9% and loaded inversely on D1/DAT/NMDA-related density.1
The Georgiadis 2026 ENIGMA Addiction analysis makes a clear claim: the brain pattern is largely shared across alcohol, cocaine, nicotine, cannabis, amphetamines, and opioids; the affected cortical regions are network hubs; and the spatial map tracks specific neurotransmitter receptor distributions rather than the pharmacology of any single drug.1
ENIGMA Addiction: A 4,733-Brain Cross-Substance Map
The 2026 study pooled T1-weighted structural MRI from 51 international sites — 2,782 individuals with at least one SUD and 1,951 healthy controls — and processed everything through a standardized FreeSurfer pipeline using the Desikan-Killiany cortical atlas.1 Site-related variance was harmonized with ComBat,2 and effect sizes (Cohen’s d) were computed for the combined SUD group and for each of six substance-specific subgroups.
Across the combined SUD phenotype:1
- Cortical thinning was nearly universal. 65 of 68 cortical regions showed FDR-corrected reductions, with the largest effects in left superior frontal gyrus (d = −0.33), left caudal middle frontal gyrus (d = −0.31), and right inferior parietal cortex (d = −0.29).
- Subcortical volumes were also reduced. 11 of 14 structures showed lower volumes, with peak effects in hippocampus (−0.25) and amygdala (−0.24).
- Substance-specific differences were ranked by effect size. Alcohol use disorder showed the largest cortical thinning (peak d = −0.47), followed by cocaine (−0.34) and nicotine (−0.28). Cannabis use was associated with more circumscribed limbic-predominant reductions, particularly in hippocampus (d = −0.27). Amphetamine and opioid effects did not survive FDR correction in their smaller samples (n = 178 and 68 respectively).
The substance-specific maps were highly correlated with each other — the same cortical regions tended to be thinned across substances, with magnitude differences rather than spatial differences explaining most of the substance-by-substance variation. Principal component analyses on the substance-specific effect-size maps confirmed this: most variance loaded on a single axis representing overall vulnerability magnitude.
Cortical Hubs Are Preferentially Thinned
One of the strongest organizing principles in the brain-disorder literature is the hub vulnerability hypothesis: highly connected regions are central to information integration, carry high metabolic demand, and are disproportionately affected across many disorders.3 The principle was first established in Alzheimer’s disease (where posterior cingulate and precuneus — both default-mode hubs — are preferentially affected) and has since been extended to schizophrenia and other psychiatric conditions.4
Georgiadis tested whether SUD fits this pattern by correlating regional cortical thinning with normative network centrality maps derived from an independent Human Connectome Project sample (n = 207).1 The result was strongly supportive:
- Functional centrality and cortical thinning were inversely correlated (r = −0.51, pspin = 0.002 against spatially autocorrelation-corrected null distributions). Regions sitting on the most-connected cortical backbone showed the most thinning.
- Structural centrality showed the same pattern (r = −0.49, pspin < 0.0001).
- Subcortical volume reductions did not show centrality coupling. Subcortico-cortical hubs weren’t preferentially affected, suggesting the hub-vulnerability principle operates within cortex rather than across the cortical-subcortical boundary.
Substance-specific analyses confirmed the cortical hub vulnerability across most substances: alcohol, cocaine, and amphetamines all showed significant negative correlations between cortical thickness and both functional and structural degree centrality (all r < −0.30, FDR-pspin < 0.05). Nicotine and cannabis showed significant associations with structural centrality only.
This is meaningful because it argues against a simple “the drug damages the regions where it acts” story. Cocaine doesn’t preferentially thin striatum because that’s where it binds; nicotine doesn’t preferentially thin acetylcholine-rich regions for the same reason.
Instead, all six substances disproportionately affect the regions that are hardest-working in the network architecture — the same regions affected by neurodegenerative disease and other psychiatric conditions.
Strong Spatial Overlap With Schizophrenia and Bipolar Disorder
The cross-disorder analysis is where the addiction-as-shared-vulnerability framing gets its strongest support. Georgiadis compared SUD epicenter maps against ENIGMA meta-analytic case-control maps for six other psychiatric conditions: schizophrenia, bipolar disorder, major depressive disorder (MDD), obsessive-compulsive disorder (OCD), ADHD, and autism.
Cortical and subcortical SUD epicenters showed:1
- Strong correspondence with schizophrenia and bipolar disorder (r = 0.55–0.87 across modalities, pspin ≤ 0.047), shared across functional and structural connectivity profiles.
- Weak correspondence with OCD, ADHD, and autism.
- An inverse association with subcortical functional epicenters in MDD (r = −0.71, pspin = 0.011), suggesting MDD-related subcortical vulnerability is in different regions than SUD-related vulnerability.
The shared SUD-schizophrenia-bipolar pattern involves frontotemporal and parietal cortices, bilateral caudate nuclei, and left putamen. This converges with the long-running literature on the high comorbidity between SUD and schizophrenia (about half of people with schizophrenia have a co-occurring SUD5) and bipolar disorder (about 40% lifetime SUD comorbidity in bipolar I6).
Whether the shared brain pattern reflects shared genetic risk, shared neurodevelopmental vulnerability, or substance-driven damage in already-vulnerable people is the open mechanistic question.
The opioid-MDD specific overlap is interesting in its own right — opioid use disorder showed particularly strong correspondence with MDD epicenters, consistent with the high MDD comorbidity in opioid use disorder and with self-medication models that emphasize affective dysregulation as the bridge.7
Two Neurotransmitter Axes Shape the Pattern
The most novel mechanistic finding is the alignment of SUD cortical morphometry with specific neurotransmitter receptor distributions. Georgiadis used partial least squares (PLS) regression to relate regional cortical-thickness reductions to normative receptor density maps for 20 neurotransmitter systems (dopamine, serotonin, GABA, acetylcholine, opioid, cannabinoid, glutamate, histamine), drawn from the Hansen 2022 PET atlas.8
Two latent variables together explained ~90% of the cross-covariance:1
- LV1 (75.5% of covariance): Regions with the most SUD-related thinning had higher normative density of kappa-opioid (KOR), metabotropic glutamate-5 (mGluR5), CB1 cannabinoid, histamine-3 (H3), and mu-opioid (MOR) receptors. This axis emphasizes a shared “modulatory” neurochemistry that operates broadly across reward, salience, and stress circuits.
- LV2 (15.9% of covariance): The same vulnerable regions had lower normative density of D1 dopamine, vesicular acetylcholine transporter (VAChT), dopamine transporter (DAT), and NMDA receptors.
Both axes correlated negatively with functional and structural network centrality (LV1 r = −0.37 to −0.43; LV2 r = −0.51 to −0.48; all pspin < 0.02), meaning the receptor architecture and the network architecture jointly explain why specific cortical regions are affected.
This recasts the addiction brain story. The conventional framing emphasizes the dopamine reward circuit (mesolimbic projections, ventral striatum, ventral tegmental area) as the core target.9
Georgiadis isn’t refuting that — striatal alterations remain prominent in the data — but it argues that cortical morphometric vulnerability is shaped more by the cannabinoid-opioid-mGluR5 axis than by the dopaminergic axis. The cortical pattern of damage tracks receptor distributions of the systems that mediate stress reactivity, glutamatergic excitotoxic vulnerability, and synaptic plasticity, rather than the systems most directly engaged by the rewarding effects of the drugs.
What the ENIGMA Pattern Supports
the calibrated interpretation is calibrated. The combined SUD effect was broad, but the largest cortical effect in the pooled analysis was d = −0.33, and the largest substance-specific peak was alcohol at d = −0.47.
Those are meaningful group differences, not an individual-level MRI test for addiction.
- Cause and consequence remain unresolved. The case-control design cannot tell whether thinner cortex preceded SUD, followed chronic exposure, or reflects both processes. The SUD-by-age interactions point toward cumulative exposure, but cross-sectional MRI cannot prove the temporal sequence.
- Small subgroups weaken null claims. Alcohol (n = 902), nicotine (n = 600), cannabis (n = 286), and cocaine (n = 278) carried far more information than amphetamines (n = 178) and opioids (n = 68). Non-significant amphetamine and opioid maps should be read as underpowered, not as proof of no brain association.
- Single-SUD analyses simplify real-world substance use. The substance-specific subset excluded comorbid SUD diagnoses (2,312 single-SUD cases), but many patients use more than 1 substance. That exclusion improves interpretability and reduces ecological realism at the same time.
- Receptor and connectivity maps were normative. The PLS and hub analyses used healthy-reference PET and connectome maps, not receptor scans from the SUD participants. The result is a strong spatial scaffold, not proof that CB1, KOR, MOR, mGluR5, H3, D1, DAT, or NMDA receptors changed inside the same people.
Clinically, the imaging signature is mechanistic. It supports integrated treatment models that take stress reactivity, salience attribution, executive control, and dual-diagnosis care seriously.
It does not justify telling an individual patient that a structural MRI can diagnose addiction or quantify personal brain damage.
Questions About Addiction and the Brain
Does addiction permanently damage the brain?
Sometimes, but the categorical “permanent damage” frame is too blunt. Alcohol-related cortical thinning is partly reversible with sustained abstinence,11 while the Georgiadis analysis itself was cross-sectional and did not measure recovery.
Its moderate peak effects (d = −0.47 even for alcohol) describe group averages, not a permanent-damage verdict for every person with SUD.
Which drug is hardest on the brain?
By peak cortical-thinning effect size, alcohol use disorder shows the largest effects (d = −0.47), followed by cocaine (−0.34) and nicotine (−0.28).1 Cannabis effects are more circumscribed and limbic-predominant.
This ranking partly reflects sample size and severity: alcohol samples in ENIGMA tend to have more severe and longer-duration use disorders, which inflates effect-size estimates relative to community-level cannabis or nicotine use. The substance ranking shouldn’t be over-interpreted as a direct ranking of “neurotoxicity per dose.”
Is the brain pattern in addiction the same as in schizophrenia?
Substantially overlapping but not identical. SUD epicenter maps correlated with schizophrenia epicenter maps at r = 0.55–0.87 across modalities,1 sharing frontotemporal and parietal cortices and the caudate nuclei.
The shared pattern likely reflects a combination of shared genetic risk, shared neurodevelopmental vulnerability, and the high comorbidity of SUD in schizophrenia. The patterns aren’t isomorphic: schizophrenia shows more cortical effect overall and a different temporal pattern of progression.
Why are the effects bigger in older users?
Cumulative substance exposure compounds with normal age-related cortical thinning. Georgiadis found significant SUD-by-age interactions in cortical regions: the case-control gap was larger at older ages,1 consistent with cumulative neurotoxic effects on top of baseline aging.
The effect was specific to cortex; subcortical volumes didn’t show the age interaction.
Does this mean addiction is a “brain disease”?
The “brain disease” framing has been contested for years.14 The Georgiadis data show robust morphometric differences in addiction, organized by network and neurochemical principles — consistent with a meaningful biological substrate.
They do not show that addiction is reducible to the brain pattern, that the brain pattern causes the behavior, or that treatment must target the brain pattern specifically. The honest framing: addiction has well-documented brain correlates that share architecture with other psychiatric conditions, and useful treatment combines pharmacological, psychosocial, and environmental components.
References
- Network and receptor architectures shape brain morphometry in addiction. Georgiadis F, Milano BA et al. (ENIGMA Addiction Working Group). medRxiv. 2026 (preprint). doi:10.64898/2026.04.03.26348150
- Harmonization of cortical thickness measurements across scanners and sites. Fortin JP et al. NeuroImage. 2018;167:104-120. doi:10.1016/j.neuroimage.2017.11.024
- Network organisation of the human brain and the connectomics of mental disorders. Bullmore E, Sporns O. Nature Reviews Neuroscience. 2012;13(5):336-349. doi:10.1038/nrn3214
- The hubs of the human connectome are generally implicated in the anatomy of brain disorders. Crossley NA et al. Brain. 2014;137(8):2382-2395. doi:10.1093/brain/awu132
- Substance use disorders in schizophrenia: clinical implications of comorbidity. Volkow ND. Schizophrenia Bulletin. 2009;35(3):469-472. doi:10.1093/schbul/sbp016
- The lifetime prevalence and demographic correlates of substance use disorder in U.S. adults with bipolar I and II disorders. Hunt GE et al. Journal of Affective Disorders. 2016;206:331-349. doi:10.1016/j.jad.2016.07.011
- The self-medication hypothesis of substance use disorders: a reconsideration and recent applications. Khantzian EJ. Harvard Review of Psychiatry. 1997;4(5):231-244. doi:10.3109/10673229709030550
- Mapping neurotransmitter systems to the structural and functional organization of the human neocortex. Hansen JY et al. Nature Neuroscience. 2022;25:1569-1581. doi:10.1038/s41593-022-01186-3
- Neurobiologic Advances from the Brain Disease Model of Addiction. Volkow ND, Koob GF, McLellan AT. New England Journal of Medicine. 2016;374(4):363-371. doi:10.1056/NEJMra1511480
- Mega-analysis of gray matter volume in substance dependence: general and substance-specific regional effects. Mackey S et al. (ENIGMA Addiction). American Journal of Psychiatry. 2019;176(2):119-128. doi:10.1176/appi.ajp.2018.17040415
- Recovery of brain structure and function during abstinence from alcohol use disorder: a longitudinal MRI study. Zou Y et al. Drug and Alcohol Dependence. 2018;194:419-426. doi:10.1016/j.drugalcdep.2018.10.025
- Imaging dopamine’s role in drug abuse and addiction. Volkow ND et al. Neuropharmacology. 2009;56(Suppl 1):3-8. doi:10.1016/j.neuropharm.2008.05.022
- Effect of cannabis use on human brain function: a systematic review. Lorenzetti V et al. Lancet Psychiatry. 2020;7(2):112-128. doi:10.1016/S2215-0366(19)30330-X
- Addiction is a brain disease, and it matters. Leshner AI. Science. 1997;278(5335):45-47. doi:10.1126/science.278.5335.45