
A 2026 hospital MRI study found that the left paracingulate sulcus was present in 31 of 109 catatonia patients (28%) vs. 171 of 323 psychiatric controls without catatonia (53%), a left-hemisphere group effect that survived adjustment for age, sex, scanner, brain volume, benzodiazepines, and antipsychotics.1
Research Highlights
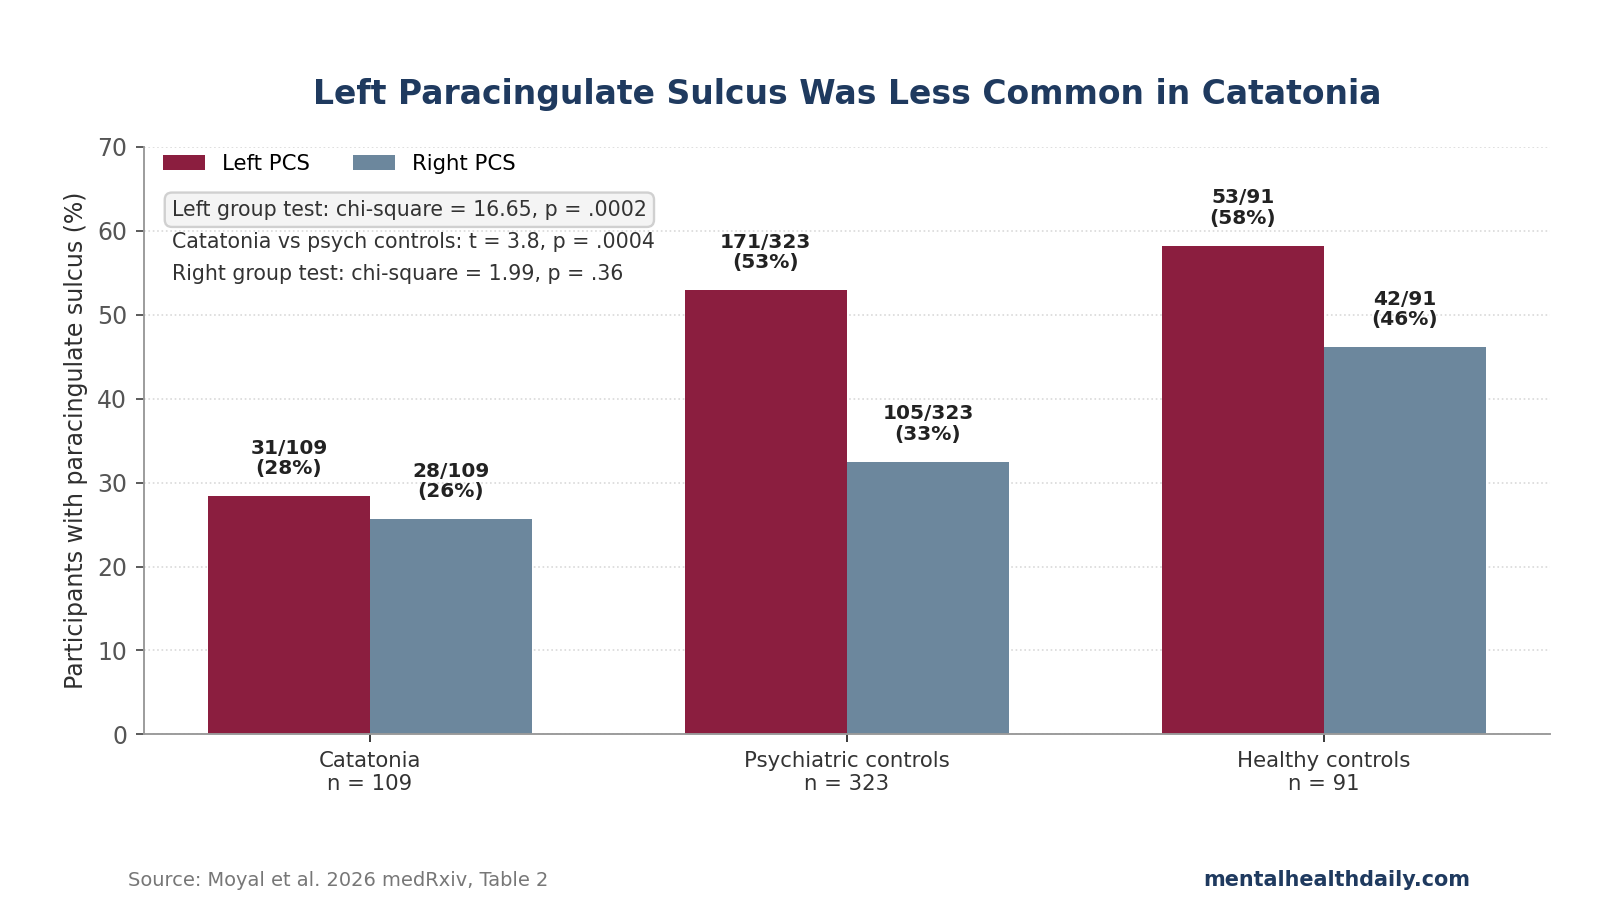
- Left PCS signal: left paracingulate sulcus (PCS) presence was 28% in catatonia vs. 53% in non-catatonia psychiatric controls; the adjusted main group effect was chi-square = 16.65, p = .0002.1
- Right side did not replicate it: right PCS presence was 26% in catatonia, 32% in psychiatric controls, and 46% in healthy controls; the right-hemisphere group test was not significant (p = .36).1
- Psychosis subgroup was clearer than mood subgroup: psychotic-disorder catatonia showed 27% left PCS vs. 49% without catatonia (p = .002), while mood-disorder catatonia showed 35% vs. 44% and did not separate statistically (p = .99).1
- Trait marker, not severity meter: Bush-Francis Catatonia Rating Scale scores were available for 39 catatonia patients, but PCS pattern did not correlate with severity (left p = .85; right p = .87).1
- Clinical use stays limited: the 523-person dataset supports a group-level neurodevelopmental vulnerability signal, not an MRI diagnostic test or a reason to change benzodiazepine or electroconvulsive therapy decisions.2
Paracingulate sulcus means an extra fold running near the anterior cingulate cortex, a medial frontal region involved in motor initiation, error monitoring, motivation, and emotion-control integration. Because this fold pattern is formed before birth and is relatively stable after birth, a PCS association points toward a trait-level vulnerability rather than a scar left by a catatonic episode.3
The useful correction is narrower than the abstract’s broadest language. Moyal et al. found a real left-sided signal, but the paper does not show that every ACC sulcal measure, every diagnosis subgroup, or every clinical severity measure points the same way.
Left PCS Was Present in 28% of Catatonia Cases vs. 53% of Psychiatric Controls
Moyal et al. analyzed T1-weighted structural MRI scans from the GHU Paris Psychiatry and Neurosciences data warehouse. The patient cohort came from 2019–2024 scans among people diagnosed with schizophrenia or mood-spectrum disorders, and catatonia status was identified through text search for “catato*” or ICD-10 catatonia codes followed by manual chart confirmation of DSM-5 criteria.1
The final sample included 523 people: 109 patients with catatonia, 323 psychiatric patients without catatonia, and 91 healthy controls. Catatonia patients were clinically different from psychiatric controls in expected ways: 82% had psychotic disorders vs. 73% of controls, benzodiazepine exposure was higher (4.5 mg vs. 2.3 mg diazepam equivalents), and antipsychotic exposure was lower (18.8 mg vs. 30.5 mg olanzapine equivalents).1
Anterior cingulate cortex (ACC) sulcal pattern was rated by blinded visual inspection. A “single” pattern meant the cingulate sulcus was present without a PCS; a “double-parallel” pattern meant a PCS also ran alongside the cingulate sulcus.
The left and right hemispheres were classified separately, and models adjusted for age, sex, scanner type, estimated total intracranial volume, olanzapine-equivalent dose, and diazepam-equivalent dose.1
The left-sided result was the main finding. Left PCS presence appeared in 31 of 109 catatonia patients (28%), 171 of 323 psychiatric controls without catatonia (53%), and 53 of 91 healthy controls (58%).
The adjusted diagnostic-group test was significant (chi-square = 16.65, p = .0002), and the corrected catatonia vs. non-catatonia psychiatric-control comparison was significant (t-ratio = 3.8, p = .0004).1
That is a large group contrast in raw prevalence: psychiatric controls without catatonia were almost twice as likely to have a left PCS as catatonia patients. The result fits the paper’s neurodevelopmental hypothesis because sulcal pattern is not expected to appear and disappear with acute psychomotor state.
Right PCS, PCS Size, and Severity Did Not Carry the Same Signal
The right hemisphere is the first check against over-reading the finding. Right PCS presence was 28 of 109 in catatonia (26%), 105 of 323 in psychiatric controls (32%), and 42 of 91 in healthy controls (46%).
The right-hemisphere group effect was not significant (chi-square = 1.99, p = .36).1
PCS size also failed to separate the groups. Linear models testing PCS extent found no diagnostic-group effect in the left hemisphere (F = .15, p = .70) or right hemisphere (F = .01, p = .91).
The paper is therefore about PCS presence and left-right patterning, not a claim that catatonia patients have a smaller PCS when the fold exists.1
Severity behaved the same way. Among catatonia patients, Bush-Francis Catatonia Rating Scale scores were available for 39 people, with a mean of 20 ± 7.
PCS pattern did not associate with severity in either hemisphere (left F = .033, p = .85; right F = .027, p = .87). That negative result is exactly what a trait-marker interpretation would predict: the fold pattern may mark vulnerability, while episode severity depends on acute illness state, medical triggers, treatment timing, and syndrome subtype.1
The Transdiagnostic Claim Is Plausible, But the Mood Subgroup Is Thin
The paper’s title and discussion emphasize catatonia “across schizophrenia and mood disorders.” That framing is directionally reasonable, but the corrected subgroup numbers need a careful read.
In psychotic disorders, the left PCS result was strong: 24 of 89 patients with catatonia (27%) had a left PCS vs. 133 of 273 psychotic-disorder patients without catatonia (49%). The corrected post hoc comparison remained significant (t-ratio = 3.6, p = .002).1
In mood disorders, the sample was much smaller and the comparison did not separate. Left PCS presence was 7 of 20 in mood-disorder catatonia (35%) vs. 38 of 86 in mood-disorder controls without catatonia (44%), with p = .99 for the corrected mood-with-catatonia vs. mood-without-catatonia comparison.
The point estimate leans in the same direction, but the data do not prove the mood-disorder subgroup on its own.1
The best reading is not “schizophrenia only.” It is also not “fully proven across every primary diagnosis.” The 523-person model supports catatonia status as the more interesting dimension than DSM label, while the mood-disorder subgroup needs replication with enough catatonia cases to test the effect cleanly.
Why a Prenatal Fold Marker Fits Catatonia Better Than a State Biomarker
Catatonia is a severe psychomotor syndrome marked by combinations of immobility, stupor, mutism, posturing, negativism, agitation, stereotypies, echo phenomena, and abnormal voluntary-movement control. It cuts across schizophrenia, bipolar disorder, major depression, autism, autoimmune encephalitis, metabolic illness, drug toxicity, and other medical contexts.2
That cross-diagnostic spread is one reason a stable developmental marker is attractive. Catatonia does not behave like a single-diagnosis complication; it behaves like a syndrome that can emerge when motor-control, salience, motivation, and affective-regulation circuits become vulnerable under different pressures.
Sulcal morphology is useful here because cortical folds form during fetal development and remain broadly stable after birth. A reduced left PCS rate in catatonia is therefore difficult to explain as a medication effect, a consequence of hospitalization, or a short-term effect of being catatonic during scanning.
Moyal et al. still adjusted for olanzapine and diazepam equivalents, but those covariates are reassurance checks rather than the main reason the sulcal argument works.1
The ACC is also anatomically plausible. It links medial prefrontal control systems with limbic and striatal circuitry, which makes it relevant to movement initiation, motivational drive, error monitoring, and affective regulation.
In catatonia, the clinical problem is more than “moving too little” or “moving too much”; it is a breakdown in starting, stopping, sustaining, and contextually regulating action.
Adjacent Catatonia Imaging Points to Cingulate-Orbitofrontal Circuits
The new left PCS finding does not appear from nowhere. Earlier catatonia imaging already pointed toward cingulate and orbitofrontal structure.
Hirjak et al. reported cortical contributions to distinct catatonia symptom dimensions in schizophrenia, including rostral cingulate and medial orbitofrontal abnormalities.4 Moyal et al. later reported orbitofrontal sulcal-pattern differences in catatonia, suggesting that atypical folding may extend across interconnected prefrontal regions rather than one isolated ACC fold.5
Psychosis research gives the same idea a broader frame. Fujiwara et al. linked anterior cingulate pathology and sulcal morphometry to schizophrenia.6
Fornito et al. reported ACC sulcal abnormalities in bipolar disorder with psychotic features.7 Yücel et al. found anterior cingulate morphology differences in young men at ultra-high risk for psychosis.8
The catatonia contribution is specificity. Moyal 2026 suggests that left PCS absence may map more closely to the catatonia dimension than to broad psychosis or mood-disorder diagnosis.
That interpretation lines up with newer work on cingulate folding and hallucinations, where reduced asymmetry appears to track symptom dimensions better than diagnostic bins.9
What the Study Cannot Turn Into Yet
No individual diagnostic test: 28% of catatonia patients still had a left PCS, and 47% of psychiatric controls without catatonia lacked one. The overlap is too large for a clinician to diagnose or exclude catatonia from an MRI fold pattern.
No treatment selector: catatonia treatment remains clinical. Benzodiazepines, especially lorazepam, and electroconvulsive therapy remain the core evidence-based options; a sulcal-pattern result does not decide dose, urgency, or whether ECT is needed.10
No proof of prospective prediction: the study was retrospective. Patients were not necessarily catatonic during MRI acquisition, and the design cannot show that left PCS absence predicts future catatonia before the syndrome appears.
That prospective claim would require following high-risk cohorts before any catatonic episode.
No clean healthy-control contrast after correction: raw left PCS prevalence was lower in catatonia (28%) than healthy controls (58%), but the adjusted catatonia vs. healthy post hoc comparison was nonsignificant (p = .75). The strongest corrected contrast is catatonia vs. psychiatric controls without catatonia.
No peer-reviewed final word: the paper is a medRxiv preprint. Its numbers are worth reading because the cohort is large for catatonia imaging and the table is specific, but replication and peer review still matter.
Practical Read: Screen Catatonia Clinically, Treat It Clinically
The immediate clinical lesson is not “order more structural MRI.” It is that catatonia should be screened across psychiatric services rather than treated as a schizophrenia-only problem. The syndrome can appear in mood disorders, psychotic disorders, neurodevelopmental conditions, and medical illness, and missing it delays treatment for a condition that can become malignant or lethal.2
Structured bedside assessment still does the work. The Bush-Francis Catatonia Rating Scale gives clinicians a shared language for stupor, mutism, posturing, waxy flexibility, negativism, excitement, echolalia, echopraxia, and related signs.
A lorazepam challenge can rapidly clarify suspected catatonia, and ECT remains critical when benzodiazepines fail, when malignant catatonia is present, or when the clinical situation is urgent.10
For research, the left PCS result is more interesting than a diagnostic-test headline. It gives catatonia a developmental anatomy clue: a stable fold pattern in a motor-affective control region may mark vulnerability that becomes clinically visible only when mood, psychosis, medical illness, or stress pushes the system into a catatonic state.
Questions About This Catatonia Sulcal-Pattern Study
Does 28% vs. 53% mean MRI can diagnose catatonia?
No. The group difference is meaningful, but the overlap is too large.
Some catatonia patients had a left PCS, and many psychiatric controls lacked one. The result is a research-level trait-marker signal, not a bedside diagnostic rule.
Did the study prove the finding across mood disorders as well as schizophrenia?
Only partially. The psychotic-disorder subgroup separated clearly (27% vs. 49%, p = .002).
The mood-disorder subgroup pointed in the same direction (35% vs. 44%) but had only 20 catatonia cases and did not reach significance (p = .99).
Why did the 39-person severity analysis matter?
If PCS pattern had tracked Bush-Francis severity, the fold might have looked more like an episode-intensity marker. It did not: left p = .85 and right p = .87.
That supports the idea of a vulnerability marker rather than a measure of how severe a current episode is.
Should treatment change if a catatonia patient lacks a left PCS?
No. Treatment decisions still come from clinical syndrome, medical risk, response to lorazepam, and urgency.
A left PCS pattern leaves in place benzodiazepine treatment, ECT referral, medical workup, or structured catatonia examination.
References
- Anterior Cingulate Cortex Sulcal Patterns associated with Catatonia across Schizophrenia and Mood Disorders. Moyal M et al. medRxiv. 2026 (preprint). doi:10.64898/2026.04.20.26351285
- Catatonia. Heckers S, Walther S. New England Journal of Medicine. 2023;389(19):1797-1802. doi:10.1056/NEJMra2116304
- Towards Deciphering the Fetal Foundation of Normal Cognition and Cognitive Symptoms From Sulcation of the Cortex. Cachia A et al. Frontiers in Neuroanatomy. 2021;15:712862. doi:10.3389/fnana.2021.712862
- Cortical Contributions to Distinct Symptom Dimensions of Catatonia. Hirjak D et al. Schizophrenia Bulletin. 2019;45(6):1184-1194. doi:10.1093/schbul/sby192
- Orbitofrontal sulcal patterns in catatonia. Moyal M et al. European Psychiatry. 2024;67(1):e6. doi:10.1192/j.eurpsy.2023.2461
- Anterior cingulate pathology and social cognition in schizophrenia: A study of gray matter, white matter and sulcal morphometry. Fujiwara H et al. NeuroImage. 2007;36(4):1236-1245. doi:10.1016/j.neuroimage.2007.03.068
- In vivo evidence for early neurodevelopmental anomaly of the anterior cingulate cortex in bipolar disorder. Fornito A et al. Acta Psychiatrica Scandinavica. 2007;116(6):467-472. doi:10.1111/j.1600-0447.2007.01069.x
- Morphology of the anterior cingulate cortex in young men at ultra-high risk of developing a psychotic illness. Yücel M et al. British Journal of Psychiatry. 2003;182(6):518-524. doi:10.1192/bjp.182.6.518
- Reassessing Asymmetry Reduction in Psychosis: Cingulate Folding and Gyrification Covariance in Patients with Auditory Hallucinations. Wu S-CJ et al. Schizophrenia Bulletin. 2025. doi:10.1093/schbul/sbaf086
- Evidence-based consensus guidelines for the management of catatonia: Recommendations from the British Association for Psychopharmacology. Rogers JP et al. Journal of Psychopharmacology. 2023;37(4):327-369. doi:10.1177/02698811231158232