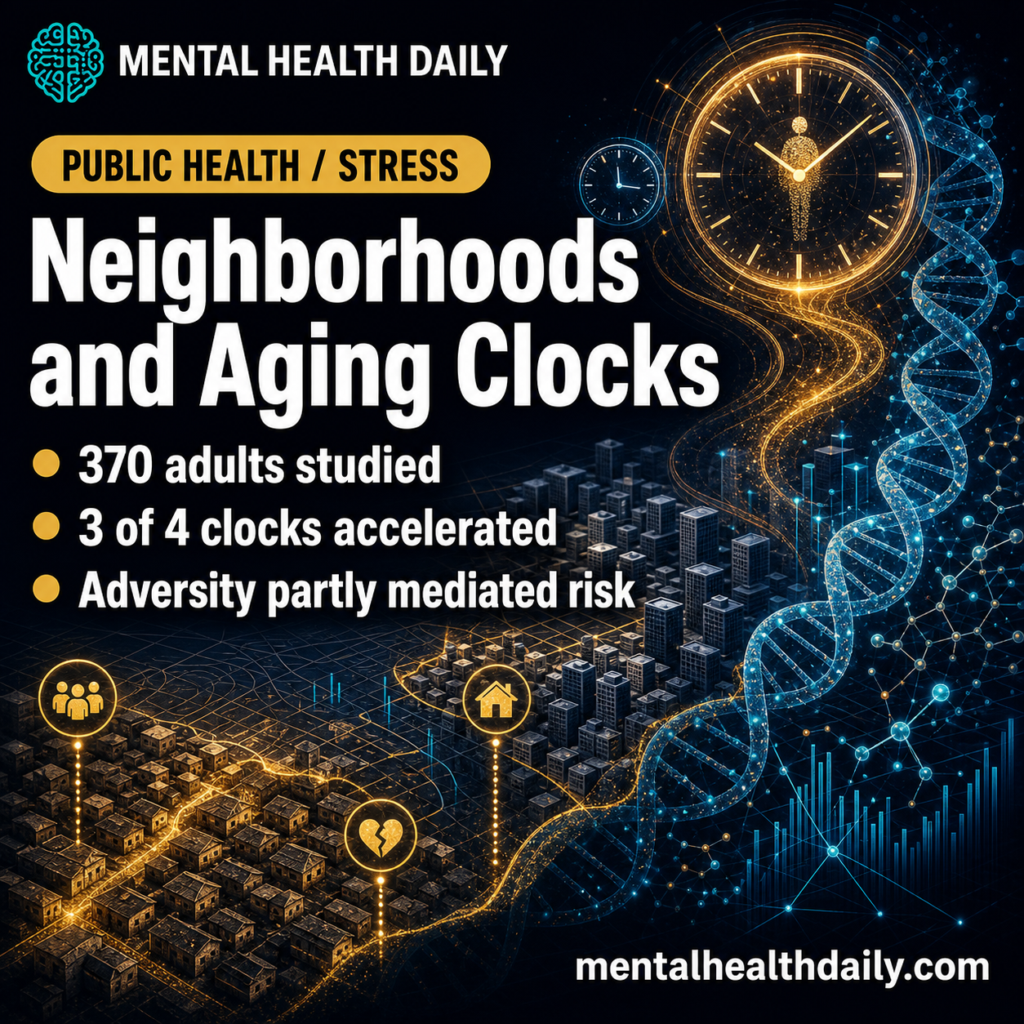
A 2026 medRxiv preprint involving 370 healthy adults found that each increase in neighborhood-deprivation percentile rank was associated with epigenetic age acceleration on 3 of 4 second-generation DNA-methylation clocks, with lifetime adversity explaining 20.3% of the GrimAge association and 23.3% of the PCGrimAge association.1
Research Highlights
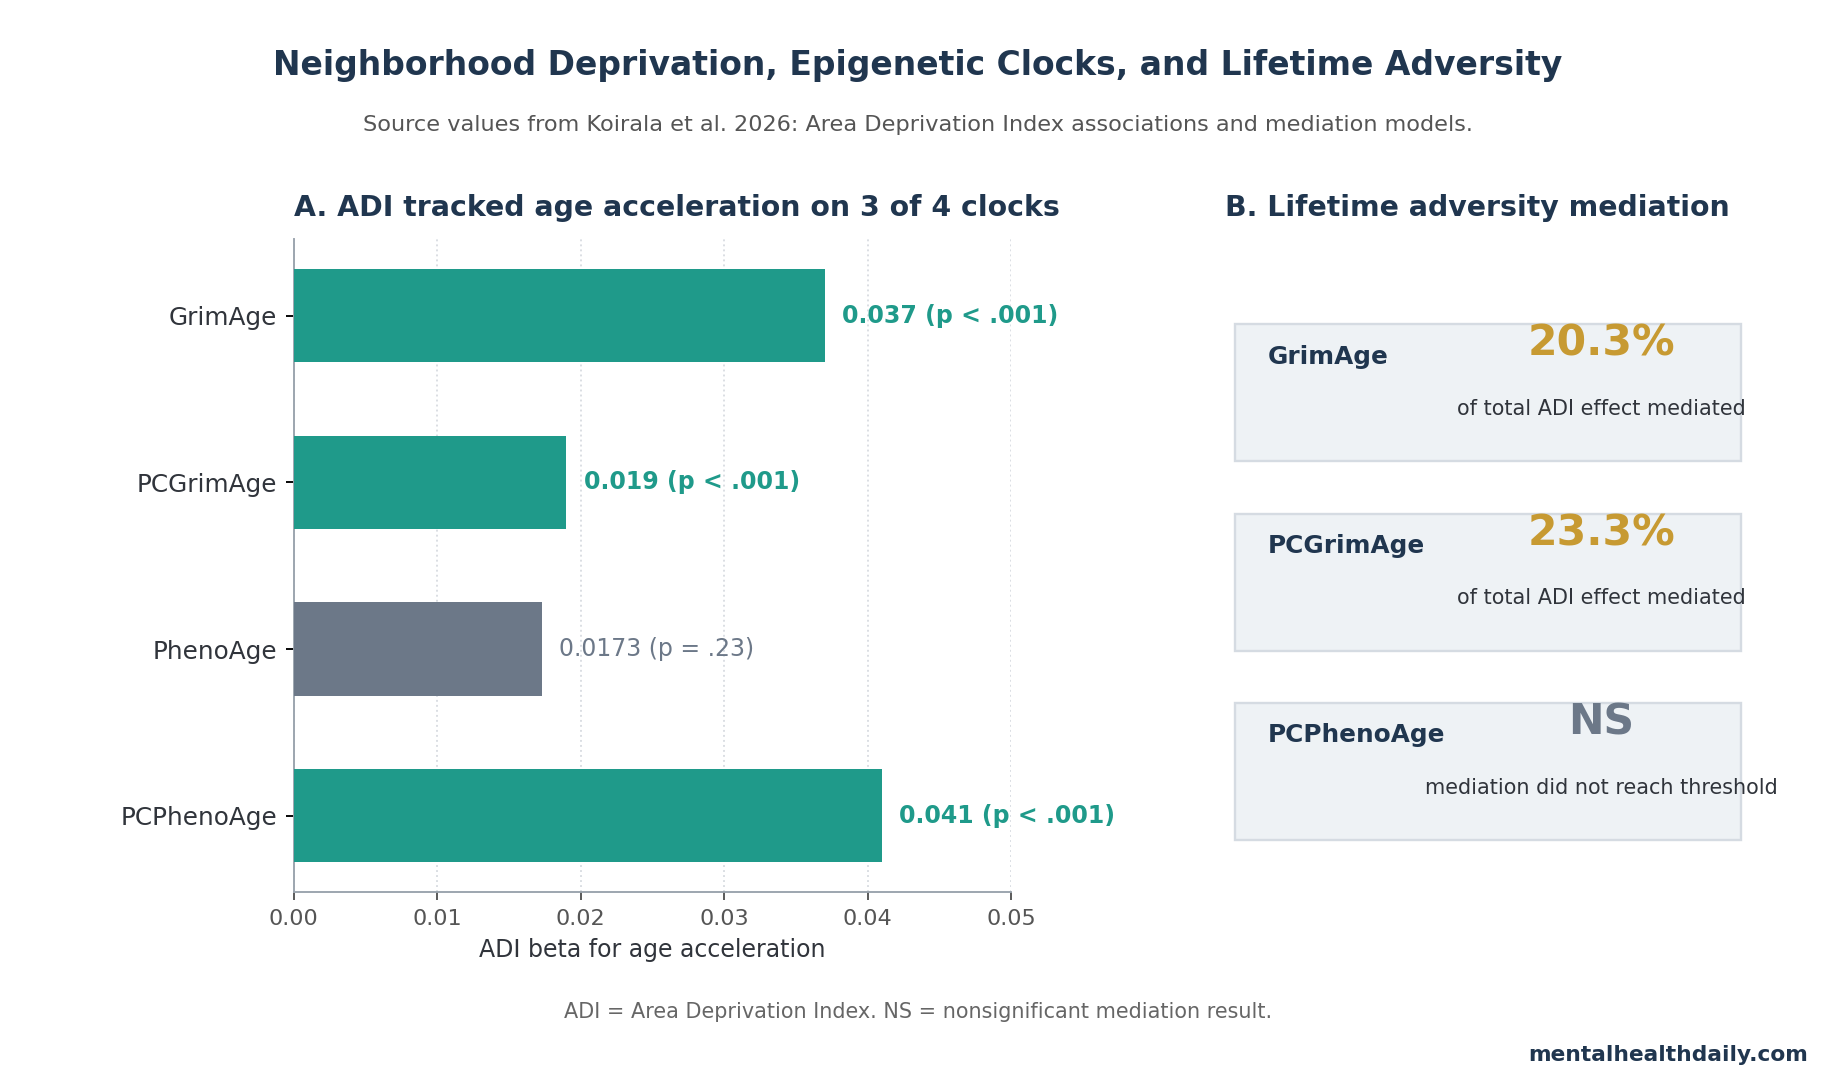
- 3 of 4 clocks accelerated: each increase in Area Deprivation Index score was associated with GrimAge acceleration (β = 0.037), PCGrimAge acceleration (β = 0.019), and PCPhenoAge acceleration (β = 0.041), all with p < .001.1
- Lifetime adversity carried part of the link: cumulative adversity partially mediated the ADI-to-GrimAge pathway (20.3%) and the ADI-to-PCGrimAge pathway (23.3%).1
- PhenoAge was the weak clock: the standard PhenoAge acceleration association was not statistically significant (β = 0.0173; p = .23), so “all clocks accelerated” would overstate the result.1
- Race moderation was reported: ADI had direct associations with GrimAge (β = 0.061; p = .004) and PCPhenoAge (β = 0.057; p = .02) for Black participants compared with White participants.1
- The design was associative: this was a cross-sectional preprint, not a causal neighborhood-move experiment, and ADI measured residence at enrollment rather than lifetime neighborhood exposure.1
Epigenetic clocks are DNA-methylation algorithms that estimate biological aging from chemical marks on DNA. Second-generation clocks such as GrimAge and PhenoAge were trained to track aging-related morbidity and mortality better than older clocks that mainly predicted chronological age.9
Area Deprivation Index (ADI) is a census-based neighborhood disadvantage score that combines income, education, employment, and housing measures into a national percentile rank.8 In this study, higher ADI meant more neighborhood deprivation, not an individual diagnosis or a direct measure of personal income.
ADI Tracked Faster Aging on GrimAge, PCGrimAge, and PCPhenoAge
Koirala et al. analyzed a Yale Stress Center community cohort recruited in greater New Haven, Connecticut, between 2008 and 2012.1 Participants were 18–50 years old, had blood DNA-methylation data, and had geocoded residential addresses. The analytic sample included 212 women (57.3%), 158 men (42.7%), 270 White participants (72.3%), 71 Black participants (19.2%), and 29 participants classified as other or multiracial (7.8%).
The main result was not a generic “stress ages people” claim. Higher ADI scores were associated with accelerated epigenetic aging across 3 second-generation clocks:
- GrimAge: β = 0.037; p < .001.
- PCGrimAge: β = 0.019; p < .001.
- PCPhenoAge: β = 0.041; p < .001.
- PhenoAge: β = 0.0173; p = .23.
Principal-component clocks such as PCGrimAge and PCPhenoAge are versions of existing clocks designed to improve measurement reliability by reducing technical noise in methylation data.9 Their inclusion matters because a signal that appears across both conventional and principal-component versions is harder to dismiss as one fragile clock artifact.
Lifetime Adversity Explained About 1 Fifth of the GrimAge Link
Koirala et al. also tested whether individual stress exposure helped explain the neighborhood-aging association.1 Cumulative Adversity Inventory (CAI) is a structured interview measure of lifetime stressful events, including work, financial, traumatic, relationship, family, and neighborhood stressors. Higher ADI was associated with higher CAI scores (β = 0.112; p < .001) and lower educational attainment (β = −0.019; p = .012), but not individual income in the reported univariate table (p = .360).
Mediation analysis asked whether the ADI signal flowed partly through lifetime adversity or education. Lifetime adversity partially mediated the GrimAge and PCGrimAge associations, while education did not significantly mediate either pathway.
- GrimAge mediation: lifetime adversity accounted for 20.3% of the total ADI association, and the direct ADI effect remained significant.
- PCGrimAge mediation: lifetime adversity accounted for 23.3% of the total ADI association.
- PCPhenoAge mediation: lifetime adversity did not reach the study’s mediation threshold, although ADI remained directly associated with PCPhenoAge.
Mediation here means a statistical pathway: ADI related to lifetime adversity, and lifetime adversity related to epigenetic aging. Because the study was cross-sectional, the mediation result should be read as a plausible stress-pathway signal, not proof that neighborhood deprivation caused adversity, which then caused faster aging.
Race Moderation Points to Structural Exposure, Not Biological Race
Race moderated the direct ADI-to-aging association in 2 models. The paper reported stronger ADI associations with GrimAge (β = 0.061; p = .004) and PCPhenoAge (β = 0.057; p = .02) among Black participants than White participants.1
The cautious reading is structural, not biological. Race in this analysis is a social category that can proxy for differences in residential segregation, pollution exposure, discrimination, housing policy, policing, health-care access, wealth, and cumulative stress. It is not a genetic explanation for clock acceleration.
Holloway et al. reported that greater stress and trauma mediated race-related epigenetic-age differences between Black and White young adults in a community sample.6 Krieger et al. examined racialized, economic, and environmental injustice in epigenetic aging using NIMHD Social Epigenomics Program data.7 Those studies do not make the Koirala result causal, but they make the race-moderation finding less isolated.
Neighborhood Education and Pollution Helped Explain ADI Risk
ADI tracked several neighborhood-level exposures that are biologically plausible stressors. Higher ADI was associated with more nitrogen dioxide pollution (β = 0.032; p < .001), greater historical redlining (β = 0.0095; p < .001), lower neighborhood income (β = −0.64; p < .001), lower neighborhood educational attainment, lower percentage of White residents (β = −0.97; p < .001), and reduced food access (β = 0.013; p < .001).1
Multivariable neighborhood models narrowed the read. Higher neighborhood educational attainment was associated with decelerated GrimAge (β = −0.041; p = 0.0083) and PCGrimAge (β = −0.030; p = 0.0042). Nitrogen dioxide exposure was nominally associated with accelerated GrimAge (β = 0.24; p = 0.036). Neighborhood income, racial composition, and food access did not independently carry the clock associations in those multivariable models.1
That pattern is more useful than a broad “poor neighborhoods age people” summary. ADI behaved like a bundled exposure marker, while neighborhood education and pollution looked like candidate components that may deserve sharper follow-up.
Earlier Studies Also Link Neighborhood Disadvantage to Epigenetic Aging
Lawrence et al. analyzed neighborhood deprivation using 4 epigenetic clock metrics in the Sister Study and reported associations between higher deprivation and older biological age.2 Xu et al. later examined cumulative neighborhood disadvantage and racial/geographic disparities in epigenetic aging, extending the question from single residence snapshots toward accumulated contextual exposure.3
Trauma-focused work adds a mental-health bridge. Webb et al. studied neighborhood disadvantage and accelerated epigenetic aging after trauma, with psychological resources moderating risk.4 Kamis et al. examined life-course contextual disadvantage, psychological symptoms, and biological aging.5 The shared signal is not that every deprived neighborhood produces the same clock effect; it is that neighborhood context, trauma exposure, psychological symptoms, and methylation aging repeatedly cluster in the same risk architecture.
What the 2026 preprint adds: ADI, lifetime adversity, education, several neighborhood exposures, and race moderation were modeled in one adult community sample. That makes the paper useful as pathway evidence even though it does not settle causality.
What This Preprint Can and Cannot Support
This study supports an association between neighborhood deprivation and faster second-generation epigenetic aging in a healthy adult community sample. It also supports a plausible partial lifetime-adversity pathway for GrimAge and PCGrimAge.
It does not prove that moving to a higher-ADI neighborhood accelerates aging, that lowering ADI would reverse methylation age, or that race itself is biological cause. Residence was measured at enrollment, not across the full life course. Blood methylation clocks are useful biological-aging markers, but they are not clinical diagnoses, and clock acceleration does not map one-to-one onto depression, anxiety, dementia, or mortality risk for an individual person.
Evidence-strength note: cross-sectional preprints are best treated as hypothesis-generating. The Koirala result is coherent with adjacent studies, but clinical or policy claims would need longitudinal designs, repeated residence histories, repeated methylation measures, and intervention or natural-experiment evidence.
Measurement read: the useful signal is cumulative context. Neighborhood metrics, individual adversity, and biological-aging measures should be modeled together, then tested over time.
Questions About Neighborhood Deprivation and Epigenetic Aging
Does this mean neighborhood deprivation causes faster biological aging?
No. The study found associations, partial mediation, and race moderation in cross-sectional data. Causal direction remains uncertain because ADI, adversity, and epigenetic aging were measured in the same broad observational frame.
Why did PhenoAge not show the same signal?
Different clocks capture partly different biological and technical information. GrimAge and PCGrimAge are especially tied to mortality-related methylation patterns, while PhenoAge can behave differently across populations and exposures. The safest summary is 3 of 4 clocks, not all clocks.
Is lifetime adversity the whole mechanism?
No. Lifetime adversity explained about 1 fifth of the GrimAge and PCGrimAge associations. The remaining direct ADI signal could reflect unmeasured stress, pollution, sleep disruption, food access, medical access, chronic inflammation, safety concerns, or residential-history factors not captured by the mediation model.
Should ADI be used in mental-health or aging research?
Yes, when interpreted carefully. ADI can make neighborhood context visible in models that otherwise treat risk as purely individual. It should be paired with individual-level exposure measures, longitudinal data when possible, and clear language that avoids turning social categories into biological explanations.
References
- Neighborhood Deprivation Is Associated with Accelerated Epigenetic Aging Via Greater Individual Adversity. Koirala A et al. medRxiv. 2026 (preprint). doi:10.64898/2026.04.24.26351669
- Association of Neighborhood Deprivation With Epigenetic Aging Using 4 Clock Metrics. Lawrence KG et al. JAMA Network Open. 2020;3:e2024329. doi:10.1001/jamanetworkopen.2020.24329
- Cumulative neighborhood disadvantage and racial and geographic disparities in epigenetic aging. Xu W et al. SSM Population Health. 2025;31:101825. doi:10.1016/j.ssmph.2025.101825
- Neighborhood disadvantage and accelerated epigenetic aging in the early aftermath of trauma: The moderating role of individual psychological resources. Webb EK et al. Journal of Psychiatric Research. 2026;199:78-89. doi:10.1016/j.jpsychires.2026.03.045
- How does life course exposure to contextual disadvantage accelerate biological aging? The role of psychological symptoms. Kamis C et al. Journals of Gerontology: Series B. 2025;80. doi:10.1093/geronb/gbaf206
- Greater stress and trauma mediate race-related differences in epigenetic age between Black and White young adults in a community sample. Holloway TD et al. Neurobiology of Stress. 2023;26:100557. doi:10.1016/j.ynstr.2023.100557
- Epigenetic Aging and Racialized, Economic, and Environmental Injustice: NIMHD Social Epigenomics Program. Krieger N et al. JAMA Network Open. 2024;7:e2421832. doi:10.1001/jamanetworkopen.2024.21832
- Making Neighborhood-Disadvantage Metrics Accessible – The Neighborhood Atlas. Kind AJH, Buckingham WR. New England Journal of Medicine. 2018;378:2456-2458. doi:10.1056/nejmp1802313
- A computational solution for bolstering reliability of epigenetic clocks: Implications for clinical trials and longitudinal tracking. Higgins-Chen AT et al. Nature Aging. 2022;2:644-661. doi:10.1038/s43587-022-00248-2