Lecanemab blood biomarkers may rebound much faster than amyloid PET after treatment stops: a 2026 PK/PD model estimated that half of the Aβ42/40 treatment effect is lost within 0.5 years, compared with 12.1 years for amyloid PET signal.1
Research Highlights
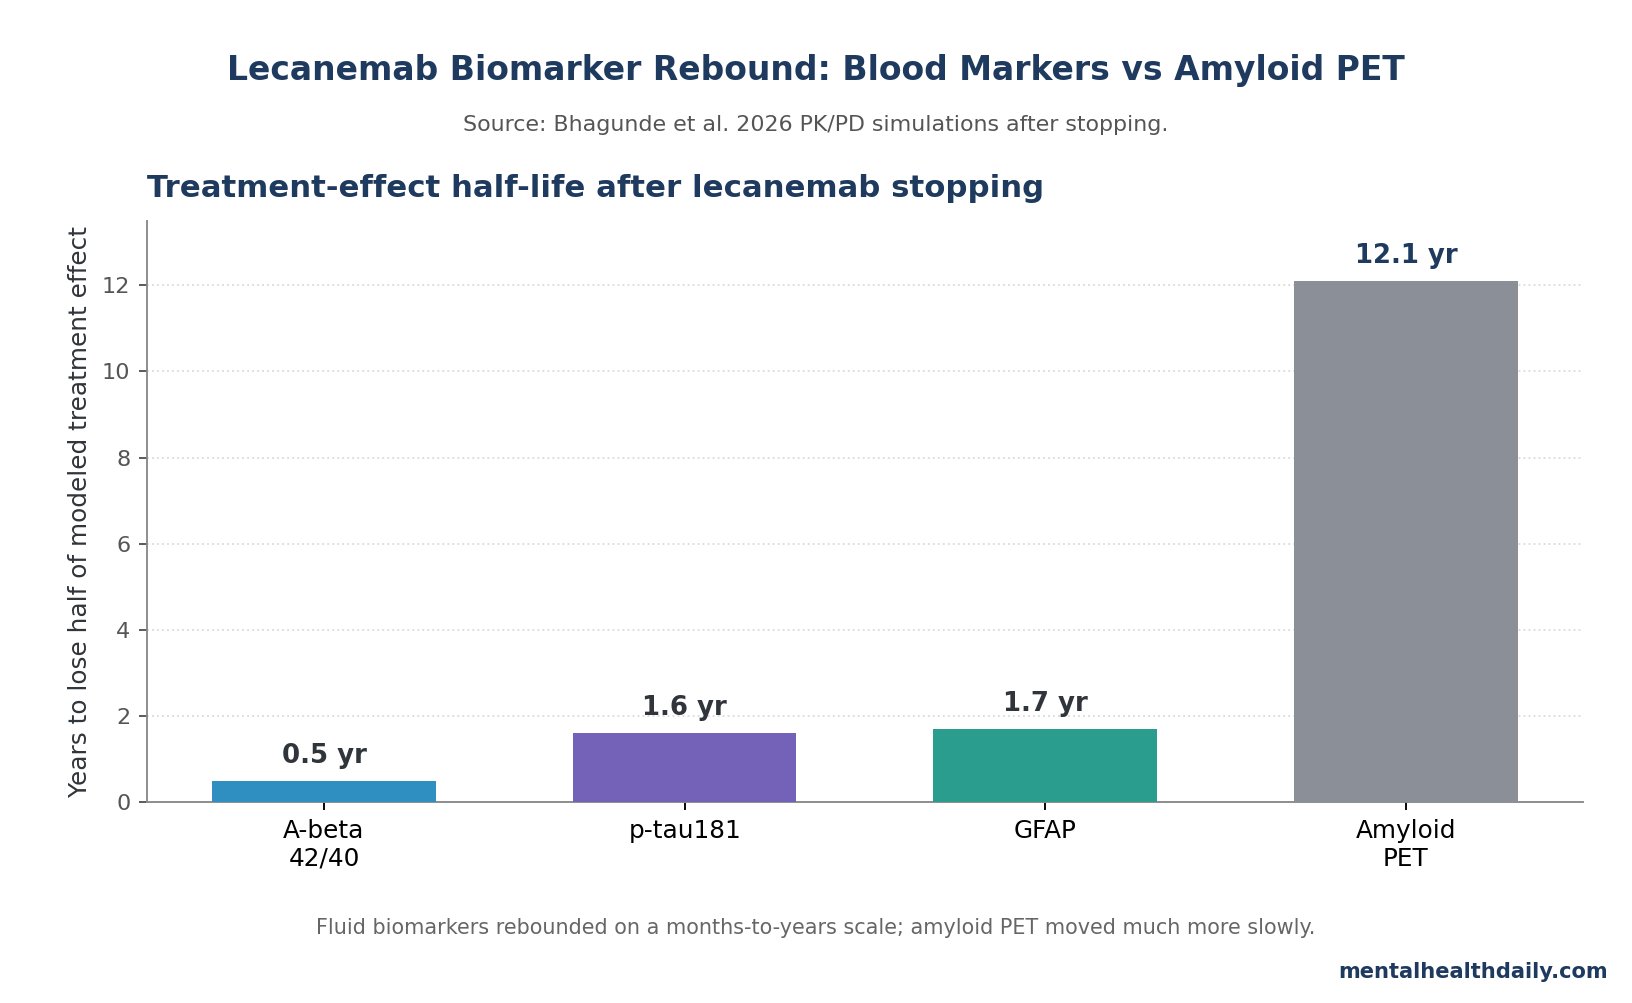
- 0.5-year rebound for Aβ42/40: Bhagunde et al. estimated that half of the Aβ42/40 treatment effect was lost within about 6 months after lecanemab discontinuation, while amyloid PET changed far more slowly.1
- 12.1-year PET contrast: amyloid PET had a modeled treatment-effect half-life of 12.1 years, so a cleared plaque scan can look stable while plasma biomarkers are already drifting back toward pretreatment biology.1
- p-tau181 and GFAP also re-accumulated: modeled half-lives were 1.6 years for plasma p-tau181 and 1.7 years for plasma GFAP, both faster than amyloid PET.1
- 18-month stopping was not biologically neutral: Study 201 had an average 24-month treatment gap after 18 months of lecanemab, and biomarkers moved back toward baseline during that interruption.1
- Monthly maintenance is a simulation-backed option: switching from 10 mg/kg every 2 weeks to 10 mg/kg monthly at 18, 24, or 30 months kept p-tau181 and GFAP near continued-treatment levels in the 48-month model.1
Lecanemab is an anti-amyloid antibody for early Alzheimer’s disease that binds soluble amyloid-β protofibrils and amyloid plaques. The clinical question is no longer only whether it clears amyloid; it is whether treatment can be de-escalated after plaque falls below a PET threshold without letting the upstream disease process restart.
Bhagunde et al. did not run a new randomized stopping trial. The 2026 analysis pooled plasma biomarker data from the phase 2 Study 201 and phase 3 Clarity AD programs, then used pharmacokinetic/pharmacodynamic modeling to connect lecanemab exposure with blood markers of amyloid, early tau, and astrocytic inflammation.1
Blood Biomarkers Moved Before Amyloid PET Looked Worse
Aβ42/40 is the ratio of amyloid-β42 to amyloid-β40 in blood. In Alzheimer’s disease, amyloid-β42 is increasingly trapped in plaques, so the plasma ratio tends to fall; when amyloid aggregation is reduced, the ratio can rise.
Plasma p-tau181 is phosphorylated tau at threonine 181, a blood marker tied to Alzheimer’s amyloid and tau biology. GFAP is glial fibrillary acidic protein, a marker of reactive astrocytes, the support cells that become activated around amyloid and neuronal injury.
The 2026 model treated these markers as dynamic pharmacology readouts rather than as independent diagnoses. During lecanemab treatment, Aβ42/40 increased, while p-tau181 and GFAP decreased. Placebo groups worsened through 18 months, and participants who later started lecanemab improved within about 3 months of treatment initiation.1
Study 201 supplied the most revealing interruption signal. Participants received lecanemab for 18 months, then had an average 24-month gap, with individual gaps ranging from 9 to 59 months. During that gap, Aβ42/40 decreased by 47%, while p-tau181 and GFAP rose by 24% and 30%, respectively.1
6 Months for Aβ42/40 vs. 12.1 Years for Amyloid PET
The strongest calibration in the paper is the time-scale mismatch. Bhagunde et al. estimated that plasma Aβ42/40 moved from about 0.087 at baseline to 0.095 after 18 months of lecanemab treatment. After discontinuation, the modeled decline was about 0.006 per year, corresponding to a 0.5-year half-life for loss of treatment effect.1
p-tau181 changed more slowly but still much faster than amyloid PET. Plasma p-tau181 decreased from 3.37 pg/mL at baseline to 2.80 pg/mL after 18 months, then re-accumulated at about 0.19 pg/mL per year after stopping. GFAP decreased from 316 pg/mL to 275 pg/mL, then re-accumulated at about 12 pg/mL per year. Their model-derived half-lives were 1.6 and 1.7 years.1
Amyloid PET is slower because it measures plaque burden, not every soluble amyloid species or downstream inflammatory response. The paper’s maintenance-treatment logic rests on that gap: a low plaque scan may lag behind soluble amyloid production, early tau signaling, and astrocyte activation.
Monthly Lecanemab Maintenance Preserved the Modeled Signal
The maintenance simulations compared continuing lecanemab 10 mg/kg every 2 weeks for 48 months with switching to 10 mg/kg monthly after 18, 24, or 30 months. Monthly dosing led Aβ42/40 to settle at a lower plateau than continued biweekly dosing, but the model kept it within the range the researchers treated as consistent with amyloid negativity.1
p-tau181 and GFAP were more reassuring in the simulation. Switching to monthly dosing at 18, 24, or 30 months kept both markers near the continued-biweekly trajectory across 48 months. Timing of the switch made little difference in the model.
The practical maintenance signal is narrower than a general “blood test guides dosing” claim. Aβ42/40 re-equilibrated to a lower plateau after monthly dosing than after continued biweekly dosing, while p-tau181 and GFAP stayed close to the biweekly trajectory. That pattern supports a fixed lower-frequency maintenance strategy after initial treatment, not frequent individualized dose changes based on every plasma-biomarker fluctuation.1
The researchers also reported little modeled difference between switching at 18, 24, or 30 months.1
Clinical implication: this supports maintenance dosing after initial plaque clearance, not biomarker-guided treatment holidays. The model says lower-frequency dosing may preserve the biological signal; it does not say stopping is equivalent.
Clinical Outcomes Still Anchor the Treatment Decision
Blood biomarkers are useful because they move quickly, are cheaper than PET, and can be sampled repeatedly. They are also dangerous to overread. A faster rebound in Aβ42/40 or p-tau181 is not the same as a visible cognitive decline in the same month.
The phase 3 Clarity AD trial remains the clinical anchor. Over 18 months, lecanemab slowed decline in early Alzheimer’s disease, but patients still declined and the absolute clinical effect was modest.2 Biomarkers help explain pharmacology; they do not replace cognition, function, adverse-event risk, or patient priorities.
Anti-amyloid treatment also carries real safety friction. Amyloid-related imaging abnormalities, infusion logistics, MRI monitoring, APOE-ε4 risk stratification, cost, and patient frailty all matter before a maintenance schedule can be treated as routine.
Plasma p-tau181 and GFAP Support Faster Treatment Monitoring
Bhagunde et al. fit a broader shift in Alzheimer’s care: plasma biomarkers are moving from research tools into treatment triage. Jack et al. showed that plasma biomarkers can predict amyloid PET and tau PET stages across the Alzheimer’s continuum, supporting blood tests as a lower-burden way to estimate pathology before confirmatory imaging or cerebrospinal fluid testing.3
Karikari et al. helped establish blood p-tau181 as an Alzheimer’s biomarker across 4 prospective cohorts, while Kim et al. found that GFAP rises across the Alzheimer’s continuum and reflects astrocytic activation.4,5 The 2026 lecanemab model adds a treatment-dynamics layer: these markers may also show biological rebound before amyloid PET looks worse.
Evidence-strength note: the maintenance conclusion comes from PK/PD modeling and simulation, not a randomized clinical trial comparing continuous biweekly dosing, monthly maintenance, and treatment discontinuation with cognitive outcomes. The model is useful because it is grounded in trial biomarker data, but it remains a model.
Limitations of This Lecanemab Biomarker Model
Industry-linked analysis: all listed researchers were Eisai employees, and funding came from Eisai and Biogen. That does not invalidate the model, but it raises the bar for independent replication and transparent assumptions.
Biomarker scope: Aβ42/40, p-tau181, and GFAP mainly track amyloid pathology, early tau pathology, and astrocytic inflammation. The paper explicitly noted that these markers are not well correlated with late tau pathology, so the model is most applicable to early Alzheimer’s disease.1
Clinical extrapolation: faster blood-biomarker rebound after stopping does not prove immediate cognitive harm. A pragmatic stopping or maintenance trial would need cognition, function, adverse events, quality of life, MRI safety monitoring, and cost.
Assay translation: plasma biomarkers vary by assay, platform, collection procedures, and threshold definitions. A clinical p-tau181 or GFAP result should not be interpreted as a universal dose-adjustment rule without assay-specific calibration.
Questions About Lecanemab Blood Biomarkers
Does this mean lecanemab should never be stopped?
No. The paper supports ongoing biological suppression after amyloid clearance, but stopping decisions still depend on adverse events, frailty, patient preference, clinical response, MRI findings, cost, and treatment burden.
Is monthly lecanemab proven to preserve cognition?
Not by this paper. Monthly maintenance preserved modeled biomarker trajectories over 48 months. Clinical preservation would require direct outcome data against continued biweekly dosing and discontinuation.
Why can blood biomarkers worsen while amyloid PET stays low?
Blood biomarkers can reflect soluble amyloid dynamics, early tau signaling, and astrocyte activation. Amyloid PET mainly reflects fibrillar plaque burden, which changes more slowly after plaque clearance.
Which blood marker rebounded fastest?
Aβ42/40 was fastest in the model, with a 0.5-year treatment-effect half-life after stopping. p-tau181 and GFAP were slower at 1.6 and 1.7 years, but still much faster than the 12.1-year amyloid PET estimate.
Can patients use p-tau181 or GFAP to adjust treatment on their own?
No. These are clinical and research biomarkers that need assay-specific interpretation. Treatment changes should go through a memory-disorders clinician familiar with anti-amyloid drug monitoring.
References
- Pharmacokinetic/pharmacodynamic analyses of plasma pathophysiology biomarkers in subjects with early Alzheimer’s disease following lecanemab treatment. Bhagunde P et al. Alzheimer’s & Dementia: Translational Research & Clinical Interventions. 2026;12:e70246. doi:10.1002/trc2.70246
- Lecanemab in Early Alzheimer’s Disease. van Dyck CH et al. New England Journal of Medicine. 2023;388:9-21. doi:10.1056/nejmoa2212948
- Predicting amyloid PET and tau PET stages with plasma biomarkers. Jack CR et al. Brain. 2023;146:2029-2044. doi:10.1093/brain/awad042
- Blood phosphorylated tau 181 as a biomarker for Alzheimer’s disease: a diagnostic performance and prediction modelling study using data from 4 prospective cohorts. Karikari TK et al. Lancet Neurology. 2020;19:422-433. doi:10.1016/s1474-4422(20)30071-5
- GFAP as a potential biomarker for Alzheimer’s disease: a systematic review and meta-analysis. Kim KY et al. Cells. 2023;12:1309. doi:10.3390/cells12091309
- Amyloid plaque reduction as a surrogate marker of efficacy: assessment of amyloid PET and change in CDR-SB utilizing semi-mechanistic model. Willis BA et al. Alzheimer’s & Dementia. 2025;20(Suppl 6):e091955. doi:10.1002/alz.091955