A 2026 Parkinson’s disease study used gene-expression data and genome-scale metabolic modeling to predict patient-level metabolite patterns, then separated 104 patients into 3 metabolic subgroups that were partly reproduced in an independent 81-patient validation dataset.
Research Highlights
- Patient-level modeling found heterogeneity: Abdik et al. predicted secretion tendencies for 802 analyzable metabolites across 104 postmortem substantia nigra samples and found 150 candidate Parkinson’s disease biomarkers.1
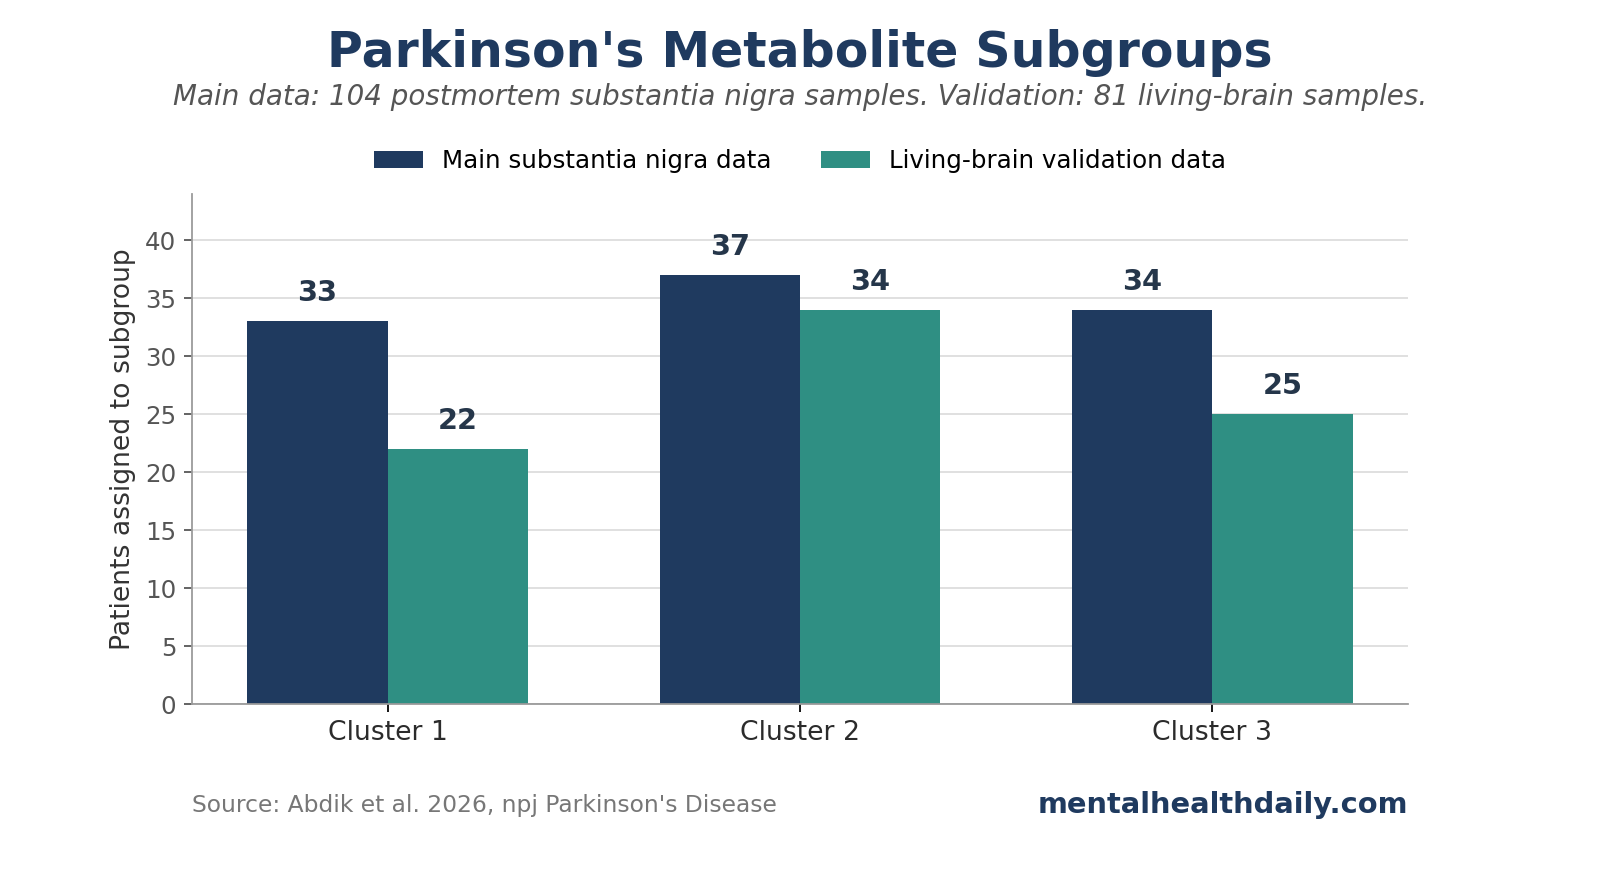
- 3 subgroups emerged: hierarchical clustering split the 104 patients into groups of 33, 37, and 34, based on predicted over- or undersecretion patterns across 665 filtered metabolites.
- Validation was partial but useful: an independent living-brain dataset assigned 81 Parkinson’s disease samples into 22, 34, and 25 patients per cluster, and 80% of merged samples kept their original cluster labels after reclustering.
- Biomarkers were not uniform: dopamine and eumelanin undersecretion matched expected Parkinson’s biology in at least 30% of patients, but some patients showed opposite-direction predictions, which argues against treating 1 metabolite signature as universal.
- Evidence strength is computational: the 2026 findings support subgroup hypotheses for Parkinson’s disease metabolomics, but they need direct measurement in blood, cerebrospinal fluid, brain tissue, symptoms, disease stage, and treatment response before clinical use.
Parkinson’s disease is usually described through motor signs, dopamine loss, and alpha-synuclein pathology, but the clinical reality is broader: patients differ in age at onset, cognitive trajectory, sleep disruption, autonomic symptoms, medication response, and progression rate.23 That variation is why subtype work has moved from bedside labels toward biology, including genetics, transcriptomics, imaging, and metabolism.45
The 2026 study by Abdik et al. focused on patient-to-patient variation in metabolite biomarkers. A metabolite is a small molecule produced, used, or modified by metabolism; examples in this paper included dopamine, salsolinol, vitamin D3, retinal, melatonin, biliverdin, amino acid derivatives, lipid molecules, and energy-metabolism intermediates.
104 Parkinson’s Samples Generated 150 Candidate Metabolite Biomarkers
The researchers started with 8 postmortem substantia nigra transcriptome datasets from Gene Expression Omnibus. The substantia nigra is the midbrain region where dopamine-producing neurons are heavily affected in Parkinson’s disease. A transcriptome is the set of RNA messages showing which genes are more or less active in a tissue sample.
They used Human-GEM, a human genome-scale metabolic model (GEM; a large map linking genes, enzymes, reactions, and metabolites), then applied TAMBOOR, short for TrAnscriptome-based Metabolite Biomarkers by On-Off Reactions. In plain English, TAMBOOR maps gene-expression differences onto metabolic reactions and asks which metabolites would be easier or harder for the modeled system to secrete in a patient compared with controls.
The modeling details matter because this was not direct metabolite measurement. The paper predicted secretion tendency, meaning whether the model expected a metabolite to be relatively oversecreted, undersecreted, or stable. The researchers began with 1,044 metabolites with defined secretion in Human-GEM, then focused on 802 metabolites after excluding poorly interpretable dipeptides and tripeptides.
The main study snapshot is compact:
- Main tissue source: 104 Parkinson’s disease substantia nigra samples from 8 postmortem datasets.
- Metabolic model: Human-GEM version 1.18.0, containing 12,995 reactions and 2,899 genes.
- Prediction target: patient-specific metabolite secretion tendency, coded as oversecreted, undersecreted, or stable.
- Consensus threshold: a metabolite had to show the same direction in at least 30% of patients to become a candidate biomarker.
- Candidate biomarkers: 150 total, including 49 predicted oversecreted and 101 predicted undersecreted metabolites.
The expected Parkinson’s signal appeared. Dopamine and eumelanin were predicted as undersecreted in at least 30% of patients. That lines up with the disease’s core dopaminergic pathology and with prior transcriptome-based metabolic modeling work from Abdik and Cakir.6
Additional metabolite signals: salsolinol, vitamin D3, retinal, glutathione-linked metabolites, lipids, amino acid derivatives, and energy-metabolism molecules also appeared in the model. Those candidates are plausible because Parkinson’s disease research has repeatedly implicated oxidative stress, mitochondrial metabolism, lipid biology, and vitamin-related pathways.37
Dopamine Stayed Central While Patient Patterns Varied
A useful metabolite biomarker should do more than appear in a disease-vs.-control list. It should also survive the obvious question: does it behave consistently enough across patients to carry clinical meaning?
Abdik et al. found that some expected Parkinson’s features were present at the group level but inconsistent at the patient level. Dopamine was generally predicted as undersecreted, yet the model also predicted dopamine oversecretion in 30 patients. The paper interpreted part of that pattern as potentially related to treatment history, especially therapies designed to raise dopamine signaling.
That is the central calibration. Dopamine remains central to Parkinson’s disease biology, while a dopamine-only biomarker story can be too coarse when patients differ by treatment exposure, tissue state, disease stage, and molecular subtype.
Several metabolite groups deserve separate attention because a dense list hides the biology:
- Dopamine-pathway metabolites: dopamine and salsolinol were among the strongest disease-relevant signals, and salsolinol has prior links to Parkinson’s disease dementia and L-DOPA-treated patients.
- Vitamin-related metabolites: vitamin D3, retinal, and a vitamin D metabolite were predicted as undersecreted and validated in the living-brain data.
- Lipid and fatty-acid metabolites: HDL, apoA1, adrenic acid, prostaglandin F1alpha, and leukotriene-related molecules appeared in patterns that fit a broader lipid-inflammation literature.
- Energy-metabolism metabolites: pyruvate, alpha-ketoglutarate, glycerol-related molecules, and GAPDH-linked pathways pointed toward mitochondrial and carbohydrate-metabolism differences.
- Heme-related metabolites: heme, biliverdin, bilirubin, and carbon monoxide appeared in subgroup-specific patterns, connecting the model to oxidative and inflammatory biology.
The reader-facing result is that Parkinson’s disease metabolism may be more subgrouped than a single biomarker panel can capture. The 150 biomarkers remain computational candidates for follow-up measurement.
3 Metabolic Subgroups Split the Main and Validation Datasets
The researchers then stopped forcing all patients into the same direction of change. They built a matrix of 665 filtered metabolites across 104 patients, with each metabolite coded as 1 for oversecreted, −1 for undersecreted, and 0 for stable. Hierarchical clustering split patients into 3 groups: 33 in cluster 1, 37 in cluster 2, and 34 in cluster 3.
Random Forest feature selection identified the 100 most discriminative metabolites separating those clusters. All 100 differed significantly across clusters by Kruskal-Wallis analysis (p < 0.05). Of those 100 discriminating metabolites, 57 also overlapped with the earlier candidate biomarker list.
The subgroup findings had cross-dataset support. Multiple correspondence analysis showed interspersed samples across datasets, and the 3 clusters drew patients from most of the 8 source datasets: cluster 1 from all 8 datasets, cluster 2 from 6 datasets, and cluster 3 from 7 datasets.
The cluster labels carried distinct metabolic profiles:
- Cluster 2: undersecretion of tyrosine-pathway metabolites such as dopamine, tyramine, and histamine, plus lipid metabolites including polyunsaturated fatty acids. SYT1, STXBP1, and SYNGR3, genes involved in synaptic vesicle function and neurotransmitter release, were markedly downregulated, with mean fold changes around 0.3-0.5. DDC, the gene encoding dopa decarboxylase, was also downregulated with a mean fold change of 0.34, raising a testable hypothesis about L-DOPA conversion.
- Cluster 3: dopamine, serotonin, tyramine, and heme-degradation products such as biliverdin and bilirubin tended toward oversecretion, while melatonin and related metabolites showed undersecretion.
- Cluster 1: a more intermediate pattern, with undersecretion of carbohydrate, energy, and glycerol-related metabolites despite upregulation of GAPDH, a central energy-metabolism gene.
Living-Brain Data Supported the 3-Group Structure
The validation dataset came from the Living Brain Project and included prefrontal cortex samples from individuals undergoing deep brain stimulation electrode implantation. After filtering and outlier removal, the validation analysis retained 81 Parkinson’s disease samples and 15 controls.
The independent validation strengthened the clustering result while leaving clinical use unresolved. Almost half of the candidate biomarkers from the substantia nigra data were validated in living-brain data: 25 oversecreted and 45 undersecreted metabolites. The validated list included dopamine, salsolinol, vitamin D3, retinal, and a vitamin D metabolite.
When the validation samples were assigned to clusters using the 100 discriminative metabolites from the main analysis, the 81 patients split into 22 in cluster 1, 34 in cluster 2, and 25 in cluster 3. A merged reclustering analysis found that 92.7% of samples originally assigned to cluster 1, 77.5% assigned to cluster 2, and 71.2% assigned to cluster 3 reclustered together. Overall, 80% maintained their original labels.
The validation statistics support subgroup discovery at the hypothesis stage. The living-brain samples came from a different brain region, a specific neurosurgical population, and a dataset with its own technical corrections. Clinical subtype claims require direct metabolite measurement, symptom mapping, longitudinal progression data, and treatment-response testing.
Metabolite Biomarkers in Parkinson’s Subtyping Research
Parkinson’s disease subtyping has a long problem: clinical subtypes are useful but unstable. Tremor-dominant, postural-instability/gait-difficulty, cognitive, autonomic, sleep, and nonmotor clusters can shift as disease progresses. Marras and Chaudhuri highlighted nonmotor subtype variation years ago, and later machine-learning work by Dadu et al. used clinical and progression data to identify Parkinson’s subtypes across cohorts.48
The newer biological-classification movement is different. SynNeurGe criteria, proposed by Höglinger et al., organized Parkinson’s disease around synuclein pathology, neurodegeneration, and gene status.5 That kind of system aims to anchor diagnosis and staging to disease biology rather than waiting for fully developed clinical syndromes.
Biochemical layer: metabolic modeling adds downstream information alongside synuclein, genetics, and imaging, including neurotransmitter metabolism, energy metabolism, lipid pathways, vitamin biology, heme degradation, and oxidative stress.
Luo et al. recently showed how difficult metabolite reproducibility can be across Parkinson’s disease metabolomics studies, finding only a small set of metabolites with consistent directional changes across multiple studies.7 Abdik et al. gave 1 reason why: some metabolites may be subgroup-specific rather than uniform across every patient.
Evidence Strength and Clinical Use
Evidence strength: moderate for a computational subgroup hypothesis, low for clinical decision-making. The study used multiple public datasets, an explicit genome-scale model, an independent validation dataset, feature selection, enrichment analysis, and reclustering. Those are real strengths.
The main limitation is the gap between predicted secretion and measured concentration. A metabolite can be high in blood, cerebrospinal fluid, or tissue because of secretion, reuptake, degradation, transport, medication exposure, diet, gut microbiome changes, disease stage, or tissue sampling. The paper explicitly noted that future work needs direct experimental validation, especially for metabolites that cross the blood-brain barrier and can be measured in peripheral biofluids.
Several interpretation rules follow:
- Treat the 150 biomarkers as computational candidates. They need direct metabolomics and clinical validation before use as a test.
- Use subgroup-aware biomarker research. The 3-cluster result argues for testing metabolic signatures inside Parkinson’s subgroups instead of averaging every patient together.
- Keep treatment implications exploratory. Cluster 2’s DDC and L-DOPA hypothesis is interesting, but treatment-response data were not tested in this paper.
- Prioritize measurable metabolites. Dopamine, salsolinol, vitamin D-related metabolites, melatonin, biliverdin, and lipid markers are easier to translate if future studies tie them to symptoms, progression, or medication response.
Questions About Parkinson’s Metabolite Biomarkers
How strong is the 3-subgroup evidence?
The evidence is strongest as a computational subgroup hypothesis. Abdik et al. found 3 metabolite-secretion subgroups and reproduced a similar 3-group structure in an independent dataset. Clinical subtype claims require direct metabolite measurement, symptom mapping, longitudinal follow-up, and treatment-response testing.
What kind of biomarker measurement was used?
The main analysis predicted metabolite secretion tendencies from transcriptome data mapped onto a genome-scale metabolic model. This is a discovery method that needs direct blood, spinal-fluid, or brain metabolomics follow-up.
Which findings are most important for future Parkinson’s research?
The strongest follow-up targets are metabolites that appeared in both the main and validation analyses and have plausible Parkinson’s biology: dopamine, salsolinol, vitamin D3, retinal, melatonin, histamine, biliverdin, bilirubin, and selected lipid or energy-metabolism markers.
How close is this to guiding supplements or diet?
This remains early discovery work. The paper raised the possibility of subgroup-specific supplement or dietary strategies, while intervention studies still need to connect subgroup assignment to measured deficiency, symptoms, safety, and response.
References
- Personalized Metabolite Biomarker Predictions Reveal Heterogeneous Characteristics of Parkinson’s Disease. Abdik E et al. npj Parkinson’s Disease. 2026. doi:10.1038/s41531-026-01337-4
- Parkinson’s Disease. Kalia LV et al. Lancet. 2015;386(9996):896-912. doi:10.1016/s0140-6736(14)61393-3
- Parkinson’s Disease. Bloem BR et al. Lancet. 2021;397(10291):2284-2303. doi:10.1016/s0140-6736(21)00218-x
- Identification and Prediction of Parkinson’s Disease Subtypes and Progression Using Machine Learning in Two Cohorts. Dadu A et al. npj Parkinson’s Disease. 2022;8:172. doi:10.1038/s41531-022-00439-z
- A Biological Classification of Parkinson’s Disease: The SynNeurGe Research Diagnostic Criteria. Höglinger GU et al. Lancet Neurology. 2024;23(2):191-204. doi:10.1016/s1474-4422(23)00404-0
- Transcriptome-Based Biomarker Prediction for Parkinson’s Disease Using Genome-Scale Metabolic Modeling. Abdik E et al. Scientific Reports. 2024;14:585. doi:10.1038/s41598-023-51034-y
- Identification of Metabolites Reproducibly Associated with Parkinson’s Disease via Meta-Analysis and Computational Model. Luo X et al. npj Parkinson’s Disease. 2024;10:126. doi:10.1038/s41531-024-00732-z
- Nonmotor Features of Parkinson’s Disease Subtypes. Marras C et al. Movement Disorders. 2016;31(8):1095-1102. doi:10.1002/mds.26510