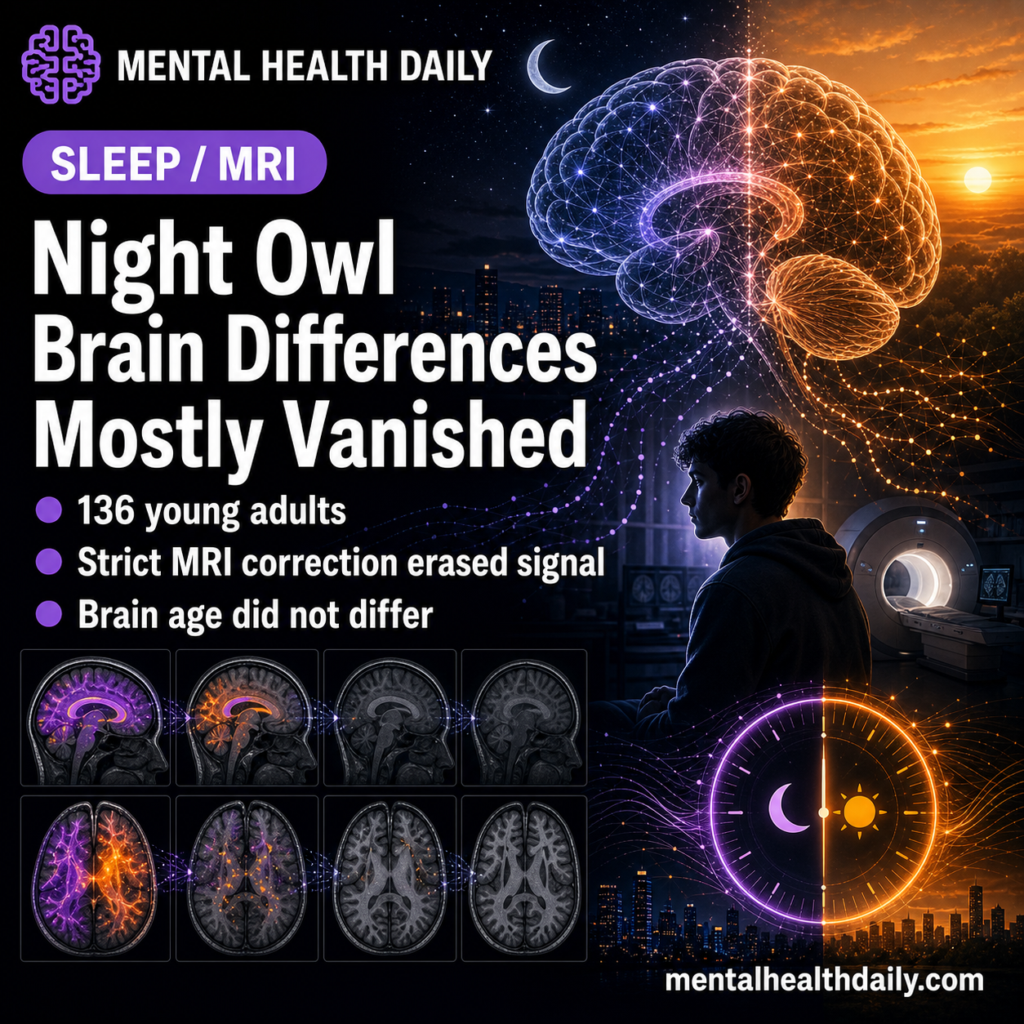
Popular coverage of chronotype neuroimaging usually claims that late chronotypes (evening types, often called “night owls”) show smaller cortical regions and faster brain aging than early chronotypes (morning types). A 2026 multimodal structural MRI analysis from Beheshti and Elkana ran the comparison in 136 healthy young adults using strict whole-brain correction, and the group differences mostly were not present.1
Research Highlights
- Whole-brain VBM produced no FWE-corrected group differences. In 68 early and 68 late chronotypes (matched on age and sex), voxel-wise analyses of gray matter and white matter showed no clusters surviving family-wise error correction at p < 0.05.1
- One exploratory cerebellar cluster came through under a looser threshold. Late chronotypes had lower gray matter volume in a left posterior cerebellar cluster (peak T = 4.05, MNI −22, −69, −24; cluster-level FDR q = 0.005) under the pre-specified exploratory framework (voxel-wise p < 0.001 uncorrected, cluster-FDR q < 0.05).1
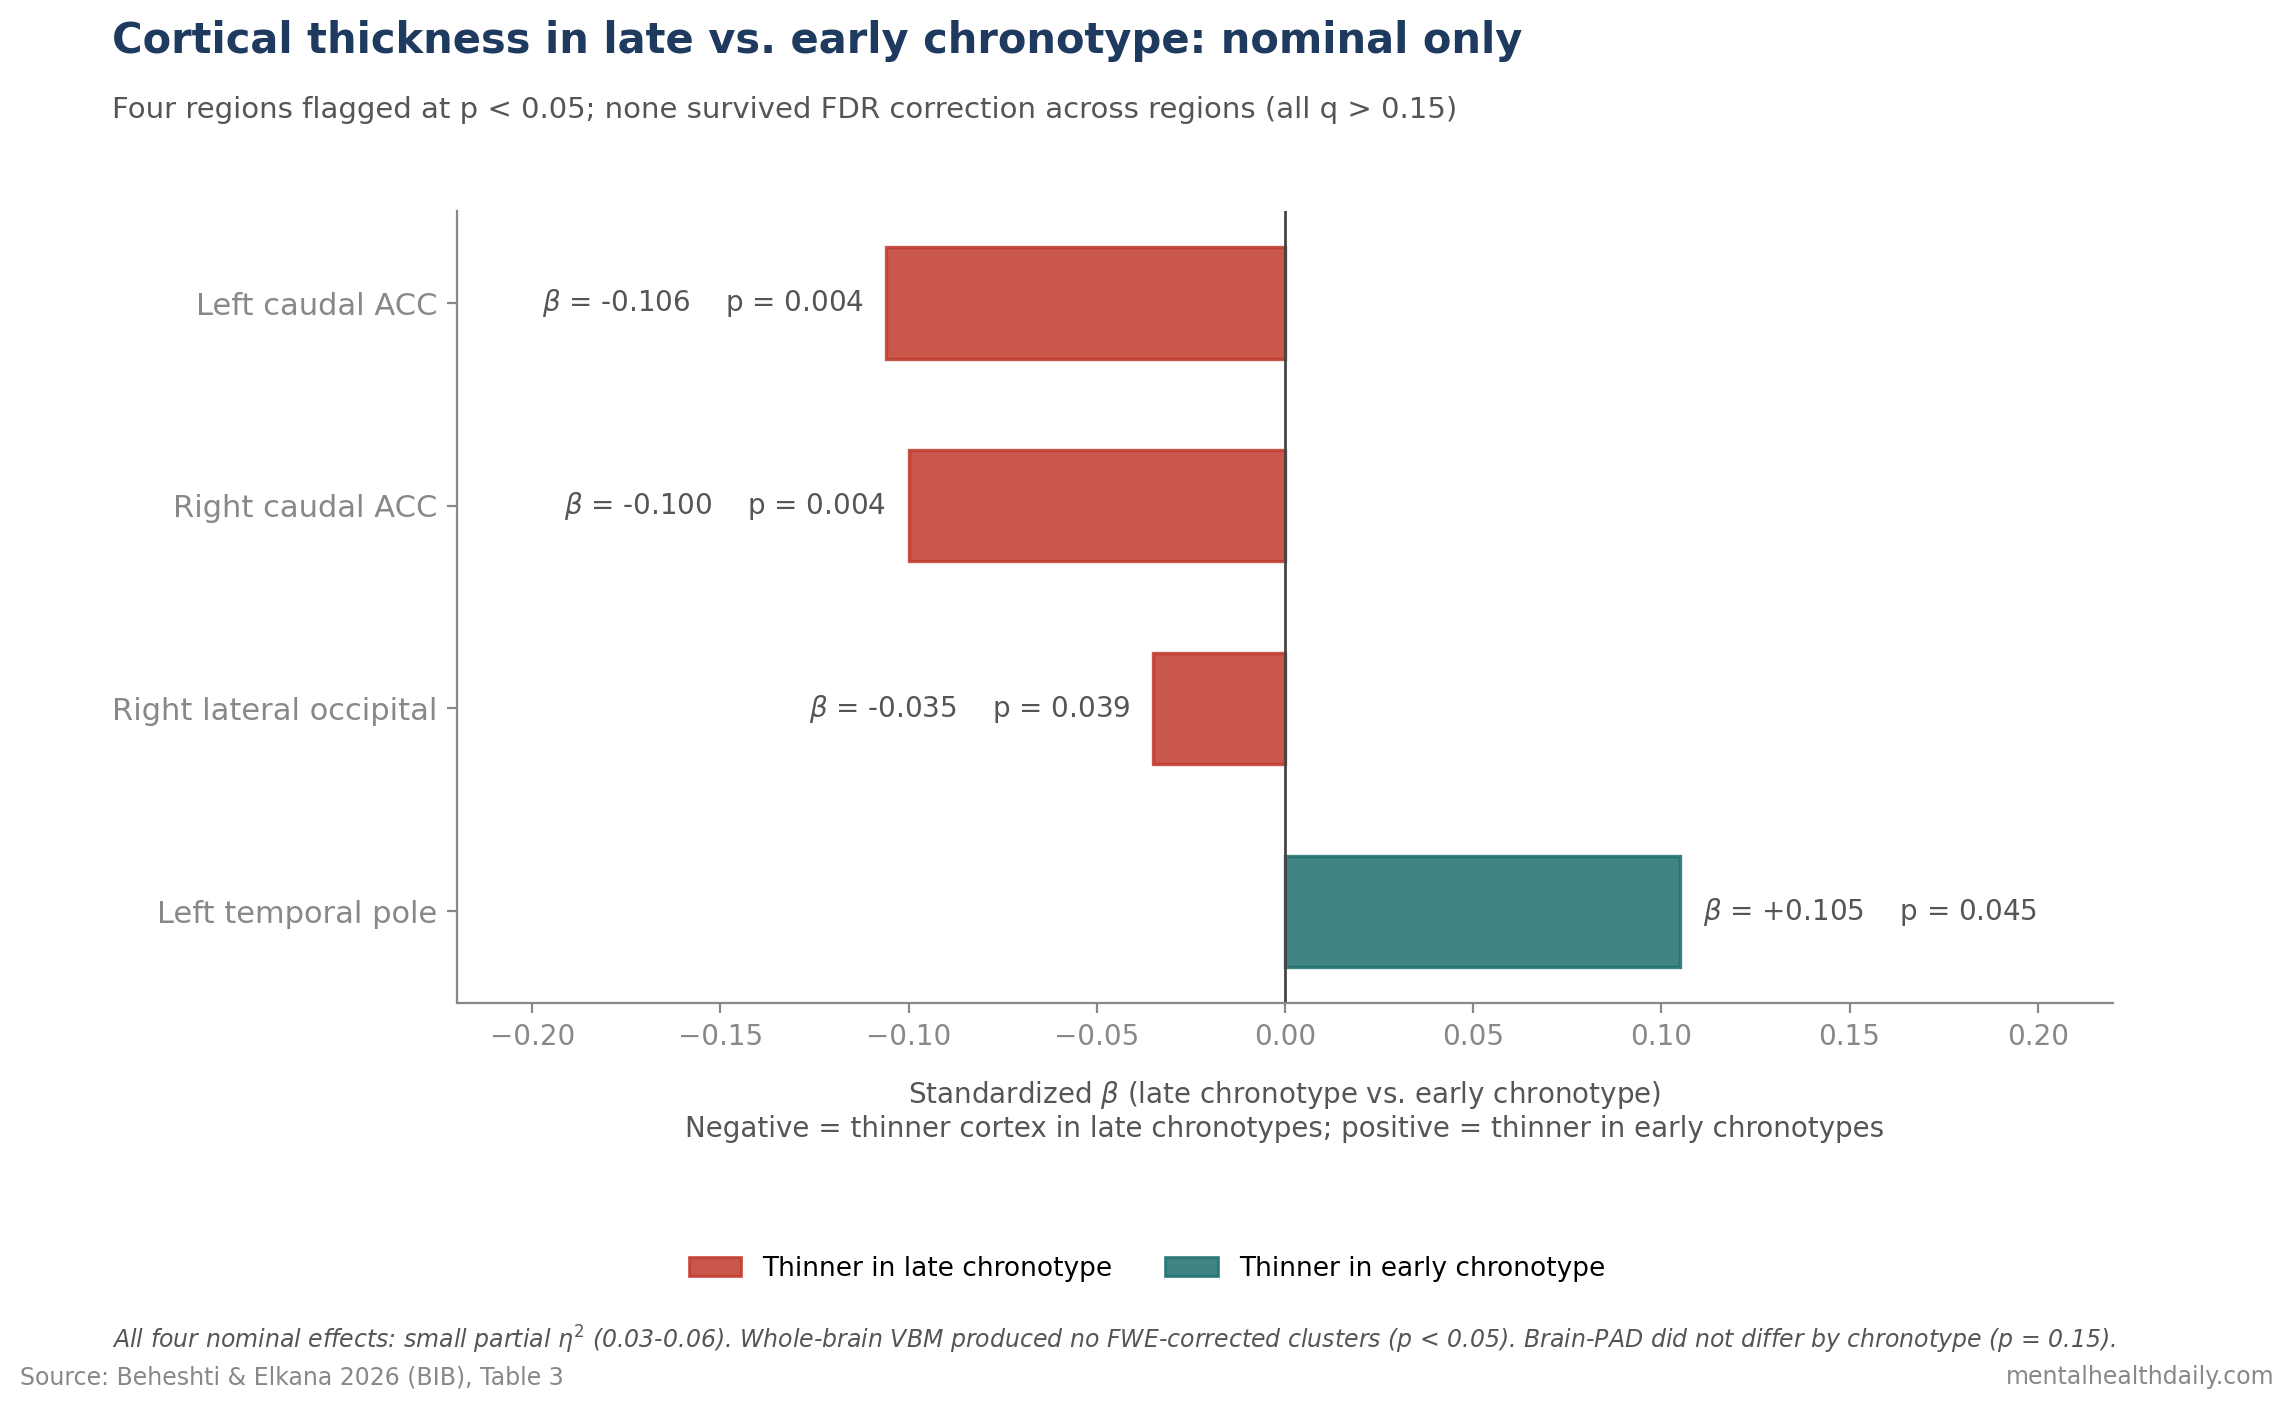
- Cortical thickness differences were nominal only. Late chronotypes showed thinner caudal anterior cingulate cortex bilaterally (β = −0.106 and −0.100, p < 0.005) and right lateral occipital cortex (β = −0.035, p = 0.039), but none of the four regional effects survived FDR correction across regions (all q > 0.15).1
- Brain-PAD did not differ by chronotype. Predicted-minus-chronological brain age was 0.6 ± 4.3 years in late chronotypes and 0.4 ± 5.2 years in early chronotypes (t(134) = −1.45, p = 0.15). No evidence of accelerated structural aging in young night owls.1
- The directional pattern matches prior reports, but the effects are small and the 136-person study was underpowered. “Night owls have different brains” is reframed by these data as “if there’s a structural signal in healthy young adults, it’s modest and regional.”1
Chronotype — the preference for early or late sleep–wake timing — is real, heritable, and behaviorally consequential. A 2019 GWAS in 697,828 individuals identified 351 loci linked to morningness, with genetic correlations to depression, schizophrenia, and well-being.2
Late chronotype prospectively predicts incident depression in middle-aged women in the Nurses’ Health Study II3 and tracks higher all-cause mortality in the UK Biobank cohort.4 Whether those behavioral and clinical differences leave a measurable structural fingerprint on the brain is a separate question — and the answer this analysis returns is mostly: not visibly, in healthy young adults, with proper correction.
The conclusion isn’t a flat null because the pattern of point estimates — the cerebellar cluster, the caudal ACC effect, the right lateral occipital effect — all sit in the direction prior smaller studies predicted. Together they suggest a regional, low-amplitude signal a 136-person study can hint at but not confirm.
Beheshti & Elkana 2026: Three Modalities, One Cohort, Pre-Registered Hypotheses
The analysis used a publicly available T1-weighted MRI dataset from OpenNeuro (n = 136 healthy young adults aged 19–35, all right-handed, no neurological or psychiatric history, none on medication).
Chronotype was classified using the morningness–eveningness subscale of the Chronotype Questionnaire (ChQ-ME): early chronotype scores 11–21, late chronotype scores 22–32. Groups were tightly matched on age and sex.1
Three structural modalities were tested in parallel:
- Voxel-based morphometry (VBM): whole-brain gray and white matter volume, measured at every tiny 3D pixel (“voxel”) and normalized to a standard brain template.
- Cortical thickness (CT): the thickness of the outer brain surface, measured across 68 anatomically defined regions, with regression models adjusting for age and sex.
- Brain-predicted age difference (Brain-PAD): the gap between an algorithm’s guess at how old your brain looks and your actual age. Positive = looks older; negative = looks younger. Model trained on 949 healthy scans, average error 4.7 years.
The statistical bar was set in advance at two levels. The strict tier required family-wise error (FWE) correction at p < 0.05 — the most conservative way to control false alarms when running thousands of comparisons across the brain. Anything that clears FWE is a “real” finding by neuroimaging standards.
The looser exploratory tier used a per-voxel p < 0.001 threshold combined with cluster-level false discovery rate (FDR) correction at q < 0.05, allowing up to 5% of flagged clusters to be false positives. Anything that clears FDR but not FWE is a hypothesis-generator, not a confirmed result.
Primary VBM and Cortical Thickness: No Survivors of Strict Correction
Comparing gray and white matter volume between early and late chronotypes voxel-by-voxel across the whole brain produced no clusters surviving FWE correction at p < 0.05.1
In plain English: nothing showed a difference big enough to clear the strict statistical bar.
White matter showed no exploratory clusters either. Total brain volume, gray matter percentage, white matter percentage, and cerebrospinal fluid percentage did not differ between groups (all p ≥ 0.34).1
Region-wise cortical thickness comparisons (adjusting for age and sex) flagged four regions at the nominal level — meaning the raw p-value was below 0.05 before correcting for the fact that 68 regions were tested.
Quick gloss: β (beta) is a standardized effect size; values around 0.1 are small.
- Left caudal anterior cingulate (a frontal region involved in attention and emotion regulation): thinner in late chronotypes (β = −0.106, t = −2.95, p = 0.0037).1
- Right caudal anterior cingulate: thinner in late chronotypes (β = −0.100, t = −2.89, p = 0.0044).1
- Right lateral occipital cortex (a back-of-brain visual region): thinner in late chronotypes (β = −0.035, t = −2.08, p = 0.039).1
- Left temporal pole (a frontal-temporal region involved in social-emotional processing): thinner in early chronotypes (β = 0.105, t = 2.02, p = 0.045).1
Effect sizes were small. Partial η² (eta-squared) ranged 0.03–0.06, meaning chronotype accounted for only 3–6% of the variance in cortical thickness in those regions.
None of the four group effects survived FDR correction (all q > 0.15).
Translation: once you account for the multiple comparisons, none of these findings hold up.
Mean whole-cortex thickness was effectively identical between groups (early: 2.63 ± 0.07 mm; late: 2.64 ± 0.05 mm; p ≈ 1). The structural signal, if real, is regional and small — not a global thinning of the cortex.
The Exploratory Cerebellar Cluster: One Honest Hypothesis-Generator
Under the looser exploratory framework (per-voxel p < 0.001 uncorrected, plus cluster-level FDR correction at q < 0.05), one gray matter region did emerge.
Late chronotypes showed lower gray matter volume in a left posterior cerebellar cluster — 4,097 voxels in size, with the strongest signal at the standard-brain coordinates (−22, −69, −24) and a peak t-statistic of 4.05.1
That cluster sat in the back-and-bottom part of the cerebellum (the brain’s “little brain,” tucked under the rear of the cortex), specifically the declive and Crus I.
Those subregions are no longer thought of as just motor coordination zones — they are implicated in working memory, executive control, and affect regulation, with dedicated loops to the prefrontal cortex.
Reduced gray matter in evening types here fits the broader literature linking late chronotype to attentional and executive variability when night owls are tested in the morning.5
Two important caveats keep this from being a confident finding.
- The cluster is exploratory, not confirmatory. The voxel-level threshold (p < 0.001 uncorrected) is the looser tier the authors pre-registered for hypothesis generation. The whole-brain FWE result — the appropriate evidentiary bar for declaring a regional effect — produced nothing.
- It is a single cluster in a single cohort with no replication built into this paper. The OpenNeuro dataset (ds003826) has been used by other researchers; whether this cluster reproduces in independent samples isn’t tested here.
Brain-PAD: No Accelerated Aging in Young Night Owls
Recall that Brain-PAD is the gap between an algorithm’s MRI-based age guess and the person’s actual age.
The algorithm worked: predicted brain age tracked real age tightly (Pearson r = 0.60, p < 1 × 10−&sup5;). An r of 0.60 is a moderately strong correlation, and the p-value means the relationship is essentially impossible to be due to chance.
What the chronotype comparison showed:
- Late chronotypes: brain looked, on average, 0.6 years older than their actual age (± 4.3 years variation).1
- Early chronotypes: brain looked, on average, 0.4 years older than their actual age (± 5.2 years variation).1
- Group difference: t(134) = −1.45, p = 0.15 — that 0.2-year gap is not statistically distinguishable from zero. A “null” result.1
- Brain-PAD as a continuous predictor of chronotype: β = 0.11, 95% CI −0.10 to 0.31, p = 0.29 — also null. (The CI crosses zero, meaning the data don’t rule out “no relationship.”)1
Brain-PAD has been the headline biomarker in many “X is associated with accelerated brain aging” claims, including older-adult cardiometabolic and psychiatric cohorts.
In this sample of 19–35-year-olds, chronotype simply does not move it.
The candidate mechanisms by which late chronotype could plausibly age the brain over time are familiar:
- Chronic sleep restriction from work schedules that fight the body clock.
- Social jetlag — the mismatch between body clock and work-week schedule.
- Light exposure misalignment from bright evenings and dim mornings.
- Comorbidity with depression and metabolic disease, both of which independently affect brain structure.
None of those tolls is yet expressed as accelerated brain aging in healthy young adulthood. The signal may emerge later in life, or brain-structure measures may simply be the wrong place to look for chronotype’s neural fingerprint.
Why Earlier Reports Looked More Robust
The Beheshti & Elkana result is in tension with several prior structural papers that reported clearer chronotype–brain relationships. Three are worth naming explicitly.
Rosenberg et al. 2018 (n = 59, Brain Structure and Function) found cortical thickness differences associated with sleep timing across distributed regions, framed as “gray matter reflects when you go to bed.”6
That study used a similar methodology but did not apply the same FWE-corrected whole-brain inference framework, and its sample size was modest.
Evans et al. 2021 (Chronobiology International) reported regional volume correlates of evening preference in the anterior occipital lobe — a finding partly mirrored by the right lateral occipital nominal effect in Beheshti & Elkana.7
The convergence at uncorrected thresholds is real; the failure to clear strict correction is also real.
Horne and Norbury 2018 reported enhanced amygdala reactivity and reduced fronto-limbic functional connectivity to fearful faces in late chronotypes — a functional, not structural, finding.8
Functional brain correlates of chronotype are likely larger and more consistent than structural ones.
Three forces probably explain the gap: stricter multiple-comparison correction in the new paper, different chronotype instruments, and small samples that make any single study’s headline effect estimate unreliable.
136 Young Adults Cannot Settle Lifespan or Sleep-Loss Effects
Power. With 68 per group, the smallest difference the study could reliably detect was a Cohen’s d of about 0.48 (a moderate effect) before any correction.
After whole-brain FWE correction, the bar is much higher. A null at this sample size narrows the plausible effect size; it does not prove no effect exists.
Population. The sample was healthy, young, medication-free, and excluded shift workers. Real-world late chronotypes often work irregular hours and accumulate social jetlag — effects this inclusion criterion filtered out.
Structural correlates may emerge in older adults, prediabetic patients, and depression cohorts even if absent here.3,4,9
Phenotyping. ChQ-ME is a self-report preference scale.
The more informative future imaging studies will use objective circadian-phase markers (dim-light melatonin onset or actigraphy-derived mid-sleep on free days) as the predictor instead.
Cross-sectional design. No one was followed over time. Whether structural differences emerge as an evening-type adult ages, or whether they are stable trait markers from adolescence, is untestable here.
Late Sleep Timing Risk Is Not a Brain-Aging Diagnosis
The clinical and lifestyle implications of chronotype don’t hinge on the structural-imaging question and weren’t actually changed by this paper.
- Late chronotype is a documented risk factor for mood and cardiometabolic outcomes. Vetter et al. 2018 found a graded association between evening preference and incident depression in the Nurses’ Health Study II.3 Knutson and von Schantz 2018 reported higher all-cause mortality in evening types in the UK Biobank.4 Anothaisintawee et al. 2017 linked late chronotype to higher HbA1c (a 3-month average blood sugar marker) in prediabetic patients.9
- Chronotype is partly genetic. The Jones et al. 2019 GWAS in 697,828 individuals identified 351 loci linked to morningness, with genetic correlations to mood disorders.2 “Just sleep earlier” oversimplifies a heritable trait.
- Behavioral interventions still help circadian alignment. Morning light, restricted evening light, consistent sleep schedules, and reducing social jetlag plausibly shift circadian phase regardless of whether they move structural MRI metrics.
- Don’t read MRI headlines as destiny. If you saw a popular article last year claiming “night owls’ brains are smaller” or “late chronotype ages your brain,” this analysis is the polite correction. The structural effects in healthy young adults are too small to clear standard whole-brain inference, and Brain-PAD shows no aging gap.
Questions About Chronotype and Brain Structure
Do night owls actually have different brains?
In healthy young adults, the largest, best-corrected MRI analysis to date (Beheshti & Elkana 2026, n = 136) found no whole-brain group differences in gray matter, white matter, cortical thickness, or brain-predicted age that survived strict multiple-comparison correction.
One exploratory cerebellar cluster came through under a looser threshold. The honest answer is “if so, modestly and regionally — not visibly under proper correction in young, healthy people.”1
Does late chronotype accelerate brain aging?
Not detectably in young adults. Brain-PAD — the gap between MRI-predicted and chronological brain age — was 0.6 years in late chronotypes and 0.4 years in early chronotypes, with no significant difference (p = 0.15).
Whether a gap emerges in older night owls is untested by this analysis.1
Is late chronotype still a real health risk?
Yes. The clinical case for treating late chronotype as a risk factor for depression, metabolic dysfunction, and mortality doesn’t run through structural MRI — it runs through prospective epidemiology (Vetter 2018, Knutson 2018) and metabolic studies (Anothaisintawee 2017).
Brain structure in young, healthy late chronotypes is mostly indistinguishable from early chronotypes; that doesn’t mean late chronotype is harmless.3,4,9
Should I try to shift my chronotype?
Chronotype has a strong genetic component (351 GWAS loci in 697,828 people2) and is not fully malleable.
Behavioral levers — bright morning light, consistent sleep timing, reduced evening light exposure, and minimizing social jetlag — reliably shift circadian phase and improve sleep quality. They do not necessarily convert an evening type into a morning type.
The goal is alignment between your biology and your obligations, not forcing yourself into someone else’s schedule.
References
- Neuroanatomical signatures of chronotype in young adults. Beheshti I & Elkana O. Brain Imaging and Behavior. 2026;20(1):80. doi:10.1007/s11682-026-01153-7
- Genome-wide association analyses of chronotype in 697,828 individuals provides insights into circadian rhythms and links to mental health. Jones SE et al. Nature Communications. 2019;10(1):343. doi:10.1038/s41467-018-08259-7
- Prospective study of chronotype and incident depression among middle- and older-aged women in the Nurses’ Health Study II. Vetter C et al. Journal of Psychiatric Research. 2018;103:156-160. doi:10.1016/j.jpsychires.2018.05.022
- Associations between chronotype, morbidity and mortality in the UK Biobank cohort. Knutson KL & von Schantz M. Chronobiology International. 2018;35(8):1045-1053. doi:10.1080/07420528.2018.1454458
- Cognitive functions and underlying parameters of human brain physiology are associated with chronotype. Salehinejad MA et al. Nature Communications. 2021;12(1):4672. doi:10.1038/s41467-021-24885-0
- Chronotype differences in cortical thickness: grey matter reflects when you go to bed. Rosenberg J et al. Brain Structure and Function. 2018;223(7):3411-3421. doi:10.1007/s00429-018-1697-y
- Evening preference correlates with regional brain volumes in the anterior occipital lobe. Evans SL et al. Chronobiology International. 2021;38(8):1135-1142. doi:10.1080/07420528.2021.1912077
- Late chronotype is associated with enhanced amygdala reactivity and reduced fronto-limbic functional connectivity to fearful versus happy facial expressions. Horne CM & Norbury R. NeuroImage. 2018;171:355-363. doi:10.1016/j.neuroimage.2018.01.025
- Later chronotype is associated with higher hemoglobin A1c in prediabetes patients. Anothaisintawee T et al. Chronobiology International. 2017;34(3):393-402. doi:10.1080/07420528.2017.1279624