
A 2026 longitudinal MRI preprint involving 54 people with Friedreich ataxia and 57 controls found 3 biologically interpretable progression subtypes: microstructure-dominant, macrostructure-dominant, and minimal/no progression.1 The clusters make biomarker heterogeneity visible at the research level, while the classifier remains too early to assign individual patients to treatment paths.
Research Highlights
- 3 MRI progression subtypes emerged: Saha et al. clustered annualized structural and diffusion MRI change from 54 Friedreich ataxia participants and 57 controls into microstructure-dominant, macrostructure-dominant, and minimal/no progression patterns.1
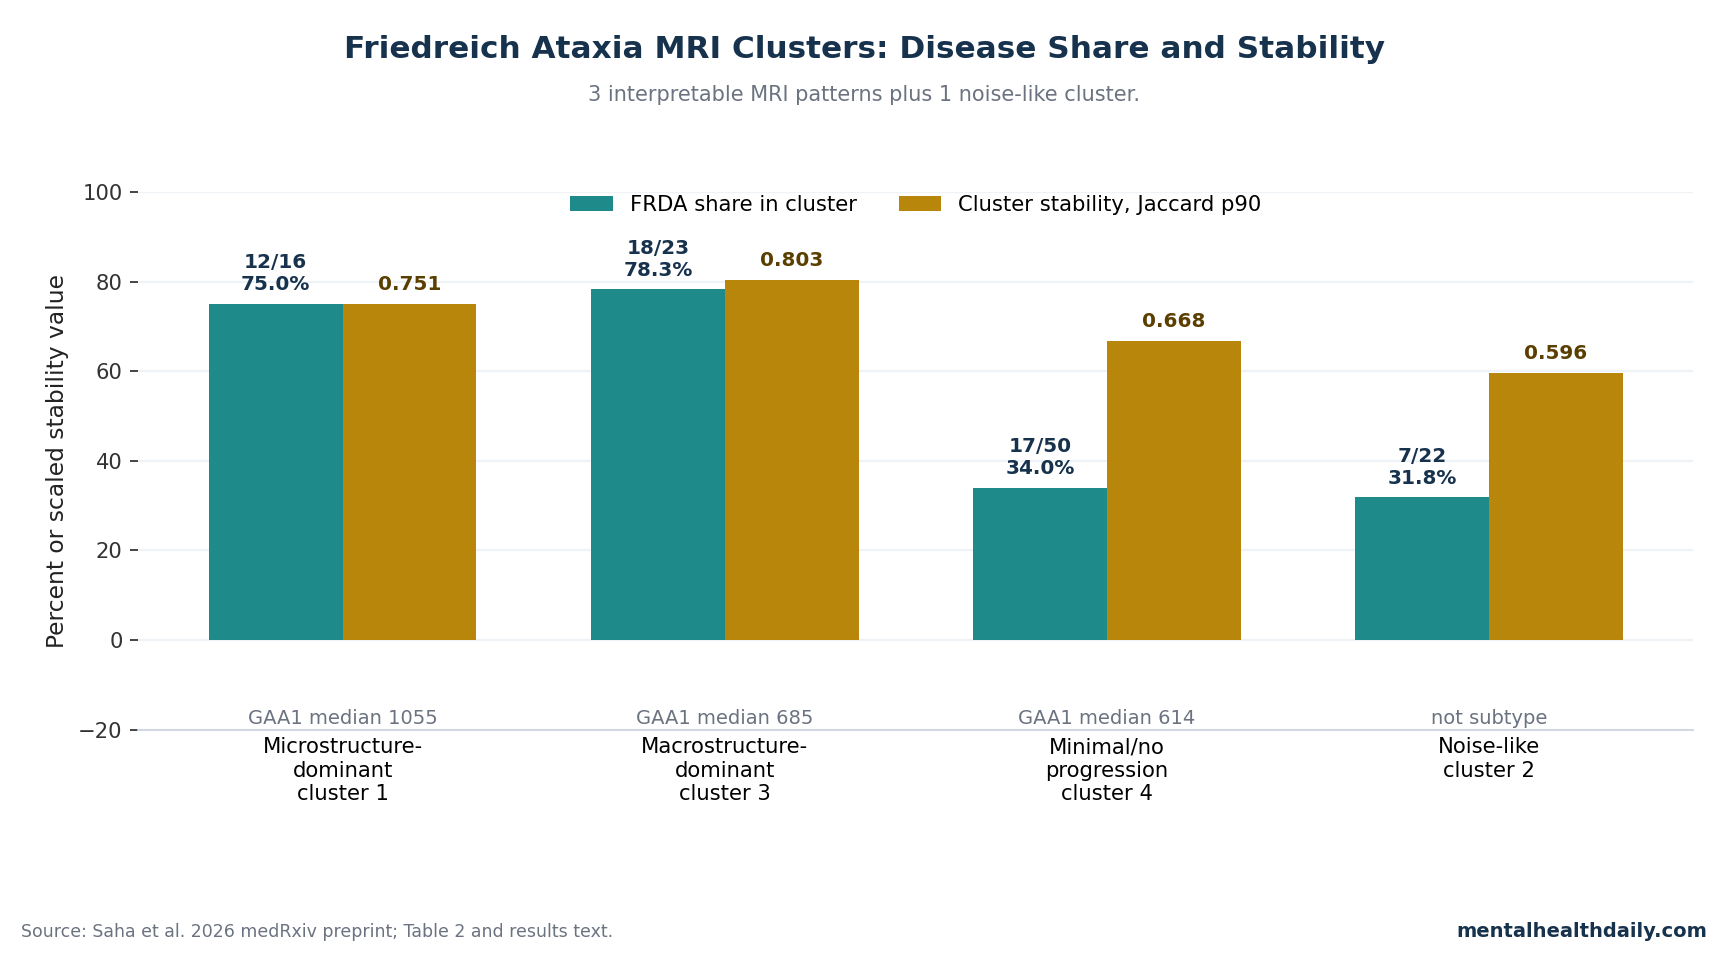
- 2 clusters were strongly disease-loaded: cluster 1 was 75.0% Friedreich ataxia (12 of 16 participants), while cluster 3 was 78.3% Friedreich ataxia (18 of 23 participants); cluster 4 was only 34.0% Friedreich ataxia.1
- Microstructural decline was not the same as volume loss: the microstructure-dominant subtype showed 2–5%/year worsening in MD, AD, and RD diffusion metrics across cerebellar peduncles, while macrostructural loss was mostly modest except 4%/year superior cerebellar peduncle volume loss.1
- Genetic burden separated the groups imperfectly: GAA1 repeat-length medians were 1055, 685, and 614 across the 3 interpretable subtypes, but a Random Forest model reached only 49.2% balanced accuracy vs. 33% chance.1
- Trial design is the near-term use case: natural-history cohorts and prior MRI studies already show heterogeneous progression over 1–4 years, so MRI-defined strata may help future trials avoid averaging unlike trajectories together.2,3,4
Friedreich ataxia is an inherited neurodegenerative disease usually caused by expanded GAA repeats in the FXN gene, which reduces frataxin, a mitochondrial protein needed for iron-sulfur cluster biology and cellular energy handling. The same single-gene diagnosis can still produce very different clinical courses: childhood vs. later onset, faster vs. slower loss of walking ability, different degrees of sensory impairment, cardiomyopathy, diabetes risk, and variable neurologic progression.5,6
Heterogeneity changes trial math. Friedreich ataxia trials are small because the disease is rare, and a treatment effect can be diluted if a trial combines patients whose nervous systems are changing through different biological routes.
Omaveloxolone became the first FDA-approved disease-modifying therapy for Friedreich ataxia after the MOXIe trial, but the broader pipeline still needs biomarkers that can detect change faster and stratify participants more intelligently.7
54 Friedreich Ataxia Participants Were Clustered by Annual MRI Change
Saha et al. pooled longitudinal MRI data from 2 research cohorts: 26 genetically confirmed Friedreich ataxia participants and 29 controls from Melbourne, plus 28 Friedreich ataxia participants and 28 controls from Campinas.1 The Melbourne cohort had baseline and 2-year follow-up imaging; the Campinas cohort had baseline and 1-year follow-up imaging.
Annualized progression rate means the researchers converted each person’s imaging change into proportional change per year: visit 2 minus visit 1, divided by the baseline value and the scan interval. This design measured whether the rate of MRI change itself formed recognizable patterns, rather than only comparing patients with controls at one time point.
The MRI feature set was specific: structural MRI and diffusion MRI, not resting-state functional MRI. Structural MRI measured volumes in the superior, middle, and inferior cerebellar peduncles; midbrain, pons, and medulla; 5 cerebellar lobar divisions; and upper cervical spinal-cord area and eccentricity.
Diffusion MRI measured fractional anisotropy, mean diffusivity, axial diffusivity, and radial diffusivity in the cerebellar peduncles. In plain English, structural MRI asked where tissue volume was shrinking, while diffusion MRI asked whether white-matter microstructure was becoming less organized.
Gaussian mixture models were the clustering tool. A Gaussian mixture model is an unsupervised machine-learning method that looks for groups in multivariable data without being told which participants have the disease label.
The researchers tested 1 to 15 clusters and selected 4 by Bayesian Information Criterion, a model-selection score that penalizes unnecessary complexity.
Cluster 1 Looked Like Diffusion-Led Cerebellar Peduncle Deterioration
Cluster 1 was the clearest microstructure-dominant subtype. It contained 16 people: 12 with Friedreich ataxia and 4 controls, so the cluster was 75.0% Friedreich ataxia.
Its 90th-percentile Jaccard stability was 0.751, meaning the same core membership pattern was fairly reproducible across bootstrap resampling.1
The defining signal was diffusion change. Mean diffusivity (MD), axial diffusivity (AD), and radial diffusivity (RD) increased by about 2–5%/year across cerebellar peduncles.
These diffusion metrics are technical, but the clinical translation is straightforward: higher MD, AD, and RD usually mean water molecules are moving through tissue in ways that suggest microstructural breakdown, especially in white-matter tracts.
Volume loss was present but not dominant. Superior cerebellar peduncle volume fell by about 4%/year, and superior-posterior cerebellar lobe volume fell by about 2%/year; other brain and spinal-cord macrostructural changes were 1%/year or less.
Compared with controls, diffusion progression rates in MD, AD, and RD across cerebellar peduncles remained significant after Benjamini-Hochberg false-discovery-rate correction at pFDR < 0.05. Fractional anisotropy did not show the same corrected signal, and volumetric measures were mostly not significant except superior and middle cerebellar peduncle volumes.
Cluster 3 Looked Like Volume-Led Brain and Spinal-Cord Loss
Cluster 3 was the macrostructure-dominant subtype. It contained 23 people: 18 with Friedreich ataxia and 5 controls, making it 78.3% Friedreich ataxia.
Its Jaccard p90 was 0.803, the strongest stability number among the 4 clusters.1
Cluster 3 had a different signature from cluster 1. Researchers reported 2–4%/year volumetric decline across nearly all brain and spinal-cord regions except the midbrain, while diffusion changes were limited mainly to 1–2%/year increases in inferior cerebellar peduncle measures.
In the follow-up tests against pooled controls, nearly all volumetric measures of brain and spinal-cord cross-sectional area differed significantly at pFDR < 0.05, except inferior-posterior cerebellar volume.
That distinction is the most useful part of the paper. A patient-level MRI trajectory dominated by white-matter diffusion worsening may not mean the same thing as a trajectory dominated by volume loss.
A trial that uses a single imaging endpoint across both patterns could miss a treatment effect if the treatment mostly affects one biological route.
Cluster 4 Was a Minimal-Progression Group, While Cluster 2 Looked Noise-Like
Cluster 4 was the large minimal/no-progression cluster. It contained 50 people, but only 17 had Friedreich ataxia, so the Friedreich ataxia share was 34.0%.
Its Jaccard p90 was 0.668. The researchers described this cluster as showing minimal or no degenerative change across macrostructural and microstructural measures.1
Noise-like cluster: cluster 2 should not be quietly counted as a fourth disease subtype. It contained 22 people, including 7 with Friedreich ataxia and 15 controls, and had the weakest stability value: Jaccard p90 = 0.596.
The researchers described cluster 2 as anatomically inconsistent, with biologically infeasible patterns such as apparent volume enlargement and diffusivity decreases. The practical interpretation is measurement variability or noise, not a clean neurodegenerative pathway.
This is where a calibrated headline matters. The study found 4 mathematical clusters, but the defensible disease claim is 3 biologically interpretable progression patterns, plus 1 noise-like cluster that should not be overpromoted.
GAA1 Repeat Length Helped, But Did Not Explain the MRI Subtypes
GAA1 repeat length refers to the size of the shorter expanded GAA repeat allele in FXN. In Friedreich ataxia, longer repeats are generally tied to earlier onset and more severe disease, but the relationship is not a one-to-one map from genotype to clinical course.
In the Saha analysis, GAA1 repeat length was the clearest non-imaging variable separating clusters.
- Repeat-length gradient: median GAA1 repeat length was 1055 in the microstructure-dominant subtype, 685 in the macrostructure-dominant subtype, and 614 in the minimal/no-progression subtype.
- Corrected group difference: cluster 1 differed from cluster 3 after correction (pFDR = 0.020), while the cluster 1 vs. cluster 4 comparison was trend-level after correction (pFDR = 0.067).
- Age-at-onset gradient: median age at onset was 11.5 years in the microstructure-dominant subtype and 20 years in the minimal/no-progression subtype, with pFDR = 0.067 for cluster 1 vs. cluster 4.
- Classifier ceiling: a Random Forest model retained only GAA1 repeat length and reached 49.2% balanced accuracy compared with 33% chance.
Genetic burden did not solve the classification problem. Per-class recall was 62.5% for cluster 1, 46.7% for cluster 3, and 38.5% for cluster 4, leaving too much uncertainty for individual clinical assignment.
That is not a clinical-grade classifier. It is evidence that GAA1 repeat length contributes to MRI-defined progression patterns while leaving substantial unexplained biology.
Molecular, epigenetic, metabolic, inflammatory, treatment-exposure, and measurement factors could all be part of the residual variation.
Prior Cohorts Already Showed Friedreich Ataxia Progression Is Uneven
The 2026 MRI subtyping result fits a broader Friedreich ataxia literature that has been moving away from one average disease trajectory.
- FACOMS natural history: Rummey et al. emphasized that heterogeneous neurological progression has direct consequences for clinical-trial design.2
- EFACTS clinical progression: Reetz et al. followed the European Friedreich Ataxia Consortium for Translational Studies cohort for 4 years, giving the field a large clinical-progression frame rather than a single static severity snapshot.3
- IMAGE-FRDA structural MRI: Selvadurai et al. reported that longitudinal structural brain changes depended on disease severity.4
- Brain MRI and ENIGMA-Ataxia: Adanyeguh et al. found early-stage MRI alterations and progression, while Harding et al. used MRI volumetrics to stage brain structure and degeneration.8,9
Saha et al. add a more specific layer: the same diagnosis can show different combinations of diffusion-led and volume-led progression over time. That is a sharper trial-design problem than “Friedreich ataxia is variable.” It says the outcome measure may need to match the biological pattern.
MRI Subtyping Is Most Useful for Trials, Not Clinic Decisions Yet
The strongest near-term use case is research enrichment. If a drug is expected to protect white-matter microstructure, enrolling many macrostructure-dominant or minimal-progression participants may weaken the detectable signal.
If a therapy is expected to slow tissue-volume loss, diffusion-led participants may need a different endpoint. Small rare-disease trials cannot afford to average away the very change they are trying to detect.
The study also supports outcome-measure matching. FARS, the Friedreich Ataxia Rating Scale, remains central for clinical assessment, but clinical scales can be noisy over short intervals because performance varies with fatigue, day-to-day symptoms, rater context, and disease stage.
MRI-derived progression rates may help choose which biological endpoint is most likely to move over 1 or 2 years.
- Use MRI subtypes as enrichment hypotheses: the 2026 clusters can guide future trial stratification, but they should not be treated as validated enrollment rules until replicated.
- Match endpoints to subtype biology: diffusion endpoints make more sense for a microstructure-dominant pattern, while volume endpoints make more sense for macrostructure-dominant progression.
- Keep clinical outcomes in the model: an imaging signal that never predicts function, ambulation, swallowing, speech, or daily life would be biomarker decoration rather than a useful trial endpoint.
The Preprint Still Has Real Validation Limits
The medRxiv warning is not cosmetic: this preprint has not been peer reviewed and should not guide clinical care by itself. The sample is large for a rare-disease MRI study but small for machine-learning subtype discovery.
Cluster stability values around 0.67–0.80 are encouraging, not definitive.
Several methodological limits should shape how the result is used:
- Cluster 2 was not biologically credible: volume enlargement and diffusivity decreases are warning signs for noise or measurement artifacts.
- Annualized percentage change assumes linearity: a 1-year or 2-year scan interval may not capture nonlinear progression, plateauing, or sudden shifts.
- Baseline burden was not directly modeled: proportional change is readable, but baseline anatomy and disease stage can still influence apparent progression.
- Classification accuracy was modest: 49.2% balanced accuracy is better than chance, but not enough for individual clinical assignment.
- Replication is mandatory: larger multi-site cohorts need to test whether the same 3 interpretable patterns reappear with comparable stability.
The result is still valuable. It gives Friedreich ataxia researchers a concrete imaging framework to test instead of treating heterogeneity as background noise.
The next step is not to market the clusters as clinical labels; it is to ask whether these MRI patterns predict future clinical change and improve trial power.
Questions About Friedreich Ataxia MRI Subtypes
Did Saha et al. use functional MRI in the clustering model?
No. The analyzed modalities were structural MRI and diffusion MRI.
The cluster model used annualized macrostructural and microstructural progression features, not resting-state functional connectivity.1
Why did Saha et al. report 4 clusters but emphasize 3 biological subtypes?
The model selected 4 clusters, but cluster 2 showed anatomically inconsistent changes and the weakest stability value, Jaccard p90 = 0.596. The defensible disease interpretation is 3 biologically interpretable progression patterns plus 1 noise-like cluster.1
Can a patient get assigned to one of these MRI subtypes now?
Not in routine care. The classifier was exploratory, used research imaging pipelines, and reached 49.2% balanced accuracy from non-imaging predictors.
Clinical use would require external replication, standardized MRI processing, and proof that subtype assignment predicts future outcomes.
Does longer GAA1 repeat length explain the microstructure-dominant subtype?
Partly. Median GAA1 repeat length was highest in the microstructure-dominant subtype at 1055, compared with 685 in the macrostructure-dominant subtype and 614 in the minimal/no-progression subtype.
But GAA1 alone did not classify patients accurately enough for clinical use.1
What would make these MRI subtypes useful in a drug trial?
A trial would need to show that subtype-stratified enrollment or endpoint selection increases power without excluding patients arbitrarily. For example, a treatment aimed at white-matter microstructure should plausibly test diffusion endpoints in a microstructure-dominant subgroup, while still tracking clinical outcomes such as FARS.
Does this change the interpretation of omaveloxolone?
No direct treatment-response claim follows from the Saha preprint. Omaveloxolone has its own trial evidence, while the MRI-subtype paper suggests a future way to reduce heterogeneity in Friedreich ataxia trials.
It does not show that any current therapy works better in one imaging subtype.7
References
- Saha S, Georgiou-Karistianis N, Teo V, et al. Multimodal MRI and machine learning uncovers distinct progression patterns in Friedreich ataxia. medRxiv. 2026. doi:10.64898/2026.04.21.26351375
- Rummey C, Corben LA, Delatycki M, et al. Natural history of Friedreich ataxia: heterogeneity of neurologic progression and consequences for clinical trial design. Neurology. 2022;99(14):e1499–e1510. doi:10.1212/WNL.0000000000200913
- Reetz K, Dogan I, Hilgers RD, et al. Progression characteristics of the European Friedreich Ataxia Consortium for Translational Studies (EFACTS): a 4-year cohort study. Lancet Neurology. 2021;20(5):362–372. doi:10.1016/S1474-4422(21)00027-2
- Selvadurai LP, Georgiou-Karistianis N, Shishegar R, et al. Longitudinal structural brain changes in Friedreich ataxia depend on disease severity: the IMAGE-FRDA study. Journal of Neurology. 2021;268(11):4178–4189. doi:10.1007/s00415-021-10512-x
- Pandolfo M. Friedreich ataxia: the clinical picture. Journal of Neurology. 2009;256 Suppl 1:3–8. doi:10.1007/s00415-009-1002-3
- Delatycki MB, Corben LA. Clinical features of Friedreich ataxia. Journal of Child Neurology. 2012;27(9):1133–1137. doi:10.1177/0883073812448230
- Lynch DR, Chin MP, Delatycki MB, et al. Safety and efficacy of omaveloxolone in Friedreich ataxia (MOXIe Study). Annals of Neurology. 2021;89(2):212–225. doi:10.1002/ana.25934
- Adanyeguh IM, Joers JM, Deelchand DK, et al. Brain MRI detects early-stage alterations and disease progression in Friedreich ataxia. Brain Communications. 2023;5(4):fcad196. doi:10.1093/braincomms/fcad196
- Harding IH, Chopra S, Arrigoni F, et al. Brain structure and degeneration staging in Friedreich ataxia: magnetic resonance imaging volumetrics from the ENIGMA-Ataxia working group. Annals of Neurology. 2021;90(4):570–583. doi:10.1002/ana.26200