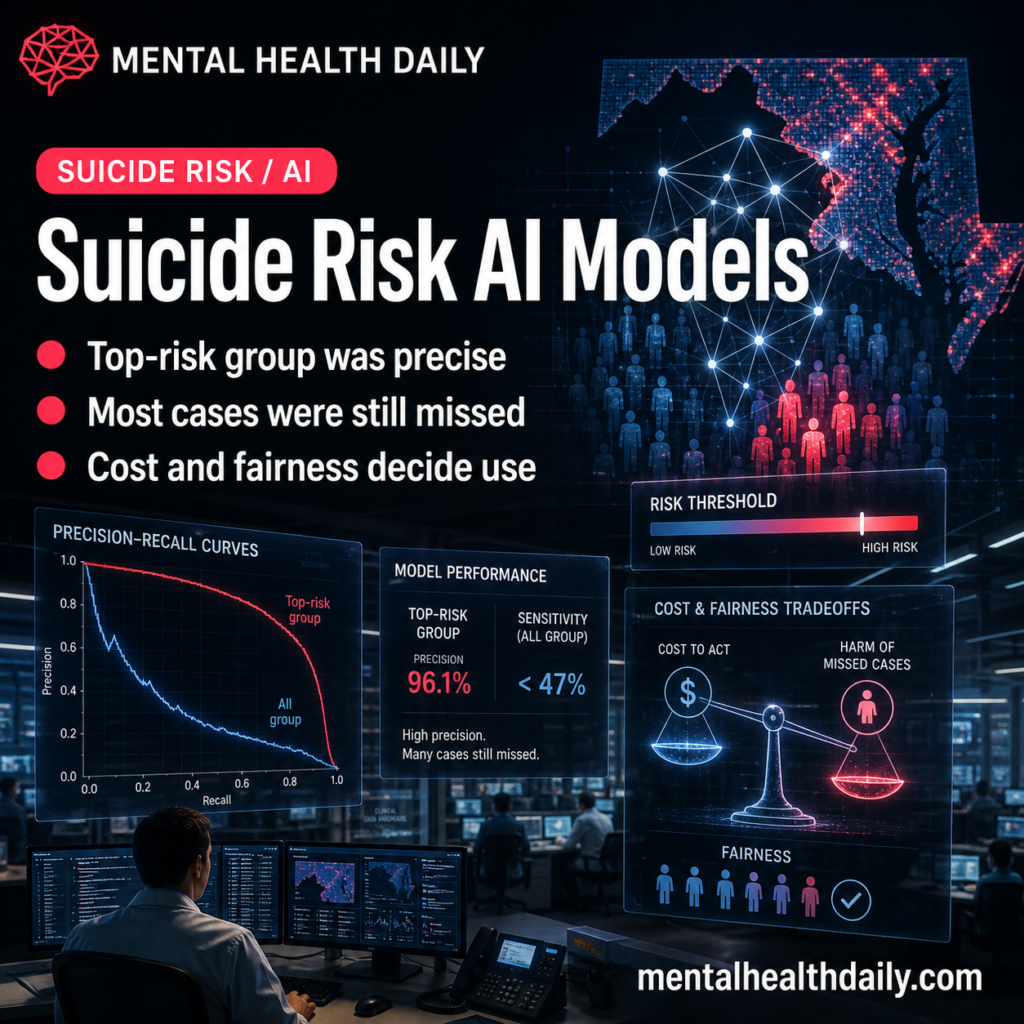
A 2026 Scientific Reports study of Maryland suicide-death records found that an XGBoost machine-learning model could reach 96.1% positive predictive value in hospital-discharge data at the top 0.1% risk threshold, but it still detected only 46.7% of suicide deaths in that cohort.
Research Highlights
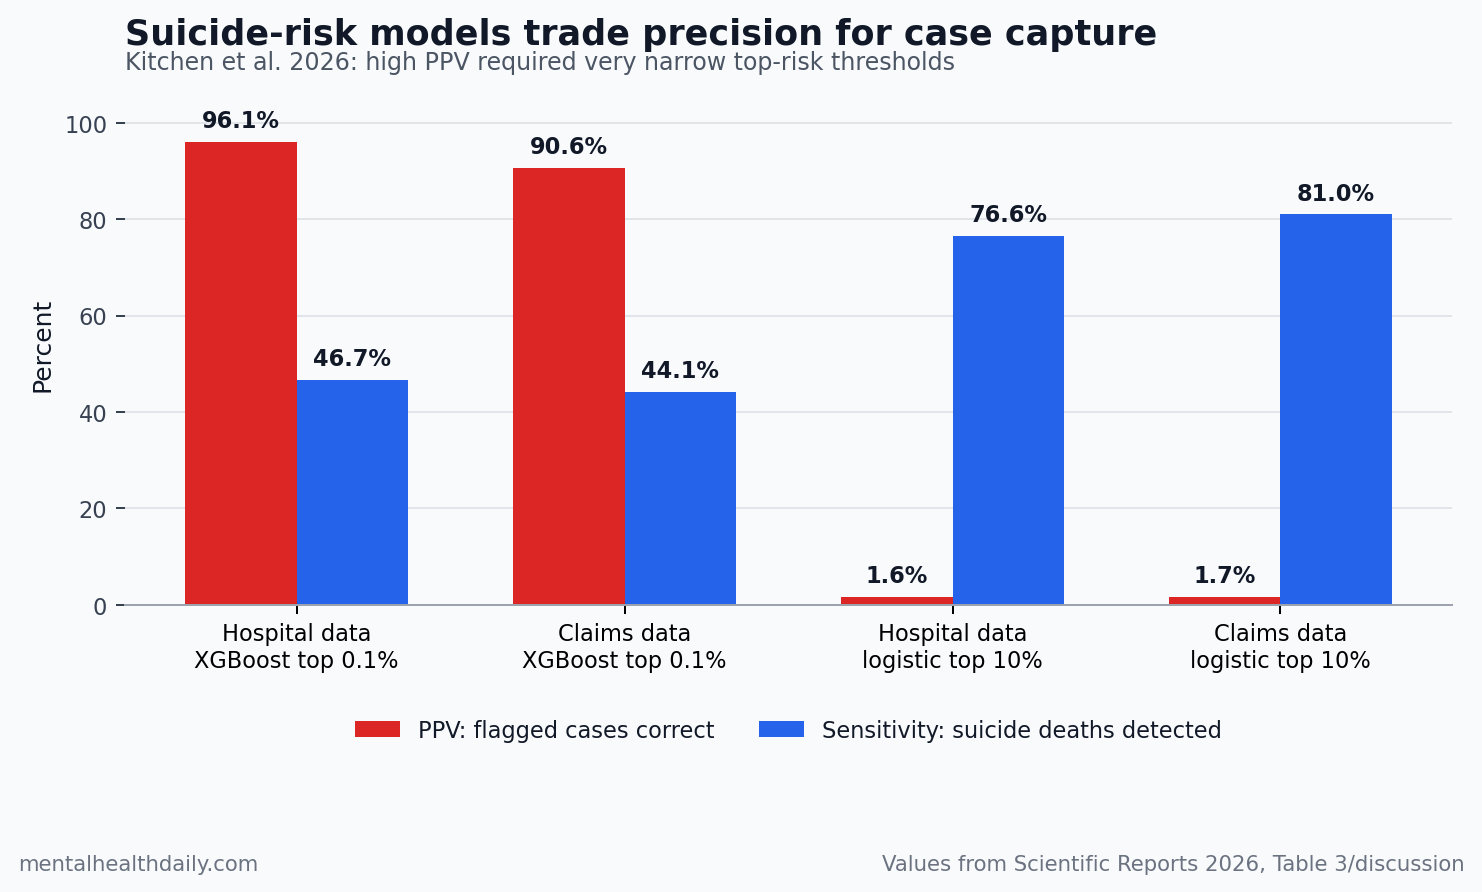
- Precision improved at the narrowest threshold: XGBoost reached PPV 0.961 in hospital-discharge data and PPV 0.906 in commercial-claims data at the 99.9th percentile risk threshold, but sensitivity stayed at 0.467 and 0.441.
- AUPRC separated the strongest models: XGBoost produced cross-validated AUPRC 0.667 in hospital-discharge data and 0.558 in commercial-claims data, both higher than the alternative models in those imbalanced cohorts.
- Broad screening still created noise: Logistic regression at the 90th percentile reached sensitivity 0.766 in hospital-discharge data and 0.810 in claims data, but PPV was only 0.016 and 0.017.
- Fairness looked condition-specific: age, sex, and race equal-opportunity gaps were mostly inside the study’s −0.1 to 0.1 fairness range, while psychiatric conditions, outpatient care, and coded social needs produced larger subgroup differences than the demographic strata.
- Clinical use depends on cost: 10x precision weighting favored logistic regression, elastic net, and XGBoost, while 10x sensitivity weighting made random forest and multilayer perceptron models more plausible.
Positive predictive value (PPV) means the share of people flagged as high risk who actually had the outcome. In suicide prediction, PPV is usually the painful metric because suicide death is rare even in high-risk clinical populations; a model can look excellent by area under the receiver operating characteristic curve (AUROC) while still creating too many false alarms for a real clinic.
Kitchen et al. reframed that problem around AUPRC (area under the precision-recall curve), a performance metric that focuses on the rare positive class instead of letting the large non-event group dominate the score. The result is not a simple AI victory lap. XGBoost looked strongest when the target was precise high-risk identification, but different thresholds and different false-error costs pointed toward different models.
XGBoost Reached 96.1% PPV Only at the Top 0.1% Risk Threshold
The study used the Maryland Suicide Data Warehouse, linking medical-examiner records, hospital-discharge data, commercial claims, and clinical records from 2017 through 2020. The analytic data included 1,944 suicide decedents, 45,585 non-suicide decedents, 846,542 hospital-discharge controls, and 844,331 commercial-claims controls.
- Core outcome: death by suicide identified through linked Maryland medical-examiner and health-record data.
- Model families: logistic regression, elastic net, random forest, XGBoost, and multilayer perceptron.
- Main evaluation target: AUPRC, with threshold, cost, and fairness checks layered on top.
The practical problem: suicide death was a rare-event prediction task in the living hospital and claims cohorts. That base-rate imbalance means a model can identify a concentrated high-risk group while still producing a very low PPV if the threshold is too broad.
At a standard probability threshold of 0.5, XGBoost had the strongest AUPRC in the 2 most imbalanced cohorts: 0.667 in the Health Services Cost Review Commission hospital-discharge cohort and 0.558 in the Maryland Health Care Commission commercial-claims cohort. Its PPV at that classification setting was also high: 0.941 for hospital discharges and 0.857 for claims.
The more clinically interpretable threshold analysis sharpened the finding. At the 99.9th percentile risk threshold, XGBoost reached PPV 0.961 with sensitivity 0.467 in hospital-discharge data, and PPV 0.906 with sensitivity 0.441 in claims data. In plain English: the tightest high-risk slice was accurate when it flagged someone, but it still missed more than half of suicide deaths in those cohorts.
90th Percentile Screening Captured More Cases but Produced Very Low PPV
High sensitivity can sound better until the denominator becomes visible. In the discussion, the researchers noted that classifying the top 10% of patients as high risk would identify around 95,000 people in the hospital-discharge and claims-style cohorts. That is a screening universe, not a small care-management list.
Logistic regression at the 90th percentile showed the tradeoff clearly:
- Hospital discharges: sensitivity 0.766, PPV 0.016.
- Commercial claims: sensitivity 0.810, PPV 0.017.
Those numbers change the correct use case.
- Low-cost outreach: a message, phone screen, or routine questionnaire can tolerate more false positives.
- High-burden intervention: emergency escalation, scarce case management, or involuntary-safety pathways need higher certainty because false positives can create stigma, wasted clinician time, and patient harm.
F-beta is one way to express that tradeoff. The statistic weights precision vs. sensitivity differently depending on whether the program cares more about reducing false positives or false negatives.
Kitchen et al. found that logistic regression, elastic net, and XGBoost looked better when precision was weighted 10 times more heavily than sensitivity. Random forest and multilayer perceptron models became more plausible when sensitivity was weighted 10 times more heavily than precision.
AUROC Alone Can Overstate Suicide-Prediction Usefulness
Prior suicide-prediction research has repeatedly warned that discrimination metrics can look impressive while clinical usefulness remains weak.
Belsher et al. reviewed and simulated suicide attempt and death prediction models and concluded that positive predictive value was usually too low for straightforward clinical use. Simon et al. showed that electronic health record models could concentrate suicide-attempt and suicide-death risk after outpatient visits, but the operational meaning depended on what the health system could do with the risk stratum.
McCarthy et al. made the same point in Veterans Affairs data: risk could be concentrated, but intervention planning still had to confront how many people were flagged and what the system could realistically offer. Barak-Corren et al. later validated an electronic health record suicide-risk modeling approach across multiple health-care systems, reinforcing that transportability and workflow fit matter as much as model ranking.
Kitchen et al. added a sharper evaluation frame for rare outcomes. AUPRC optimization tries to improve the precision-recall relationship directly instead of relying on AUROC, which can be forgiving when non-events dominate the dataset. Saito and Rehmsmeier made this methodological point in a broader machine-learning context: precision-recall plots are often more informative than ROC plots when the positive class is rare.
Fairness Was Mostly Clean by Demographics but Not by Clinical Context
The study also tested equal opportunity difference (EOD), a fairness measure comparing true-positive and false-positive behavior between groups. The researchers treated values between −0.1 and 0.1 as the conventional fair range.
For age, sex, and race, XGBoost was mostly inside or near the fairness range across cohorts. Average EOD ranged from −0.203 to −0.066 for age younger than 65, −0.032 to 0.020 for male sex, and −0.086 to 0.013 for Caucasian race. Random forest and multilayer perceptron models showed more fairness problems in some high-sensitivity settings.
Clinical subgroups were harder. EOD favored correct classifications for patients with psychiatric conditions, outpatient encounters, or coded social needs, with wider ranges across models and cohorts. That pattern is clinically plausible: patients with more documented diagnoses and care contact give the model more signal, while people with limited access to care leave thinner administrative traces.
Implementation implication: a single statewide model may underserve people with less care contact. Separate calibration for emergency care, outpatient care, commercial claims, no-primary-care groups, adolescents, older adults, or other workflow-specific populations may be more defensible than treating one model as a universal suicide-risk detector.
Clinical Decision Support Needs a Use Case Before It Needs a Model Winner
The strongest reading is not that XGBoost is always the best suicide-risk model. The stronger claim is that model choice depends on the cost of being wrong.
- High-certainty targeting: if the next step is intensive case review, specialty outreach, or a resource-heavy suicide-prevention intervention, high PPV matters more.
- Broad safety screening: if the next step is a low-cost message, a short screener, or routine follow-up, higher sensitivity may be acceptable even with low PPV.
- Fairness monitoring: if the model performs better for people with documented psychiatric care, deployment should track missed cases and flagged cases separately.
Coppersmith et al. argued for personalized dynamic models because suicide risk is heterogeneous across people and time. Kitchen et al. approached a neighboring problem from the health-system side: even before personalization, a system must decide whether the model is a narrow high-precision alert, a broad screening layer, or a subgroup-specific routing tool.
The evidence-strength note is important. This was a retrospective cross-validated analysis, not a randomized trial showing that AI-guided suicide prevention saves lives. It evaluated death by suicide in Maryland-linked records, not every form of suicidal ideation, nonfatal self-harm, crisis presentation, or treatment response. Its numbers support model-development standards and deployment caution; they do not prove bedside clinical benefit.
Questions About Suicide Risk AI Models
Does 96.1% PPV mean the model is ready for clinical use?
No. PPV 0.961 in the hospital-discharge cohort applied to the top 0.1% risk threshold under cross-validation. That is a promising high-precision signal, but prospective testing, workflow trials, subgroup monitoring, and intervention-capacity planning would still be needed before routine deployment.
Why not use the model with the highest sensitivity?
High sensitivity catches more cases, but it can create many false positives when suicide death is rare. In the study’s 90th percentile examples, sensitivity exceeded 0.76 for logistic regression in hospital and claims cohorts, while PPV was only around 0.016 to 0.017.
Why is AUPRC better than AUROC here?
AUPRC focuses on precision and recall for the rare event. AUROC can look strong because the model correctly labels many non-events, but a suicide-risk alert system is judged by whether flagged cases are meaningful and whether too many true cases are missed.
What should health systems take from the fairness results?
Demographic fairness looked relatively reassuring for XGBoost, but clinical-documentation subgroups were more uneven. Health systems should audit performance for patients with less outpatient contact, fewer coded diagnoses, sparse social-needs data, and different access patterns, including both missed cases and flagged cases, before treating an alert as neutral.
Practical Bottom Line
Suicide-risk AI should not be sold as a generic accuracy tool. Kitchen et al. showed that XGBoost can produce high PPV at very narrow thresholds, but the same evidence also shows why broad screening, intensive intervention, and fairness monitoring require different calibrations.
The safest implementation question is specific: what action follows the alert, how many people can receive it, which false error is more costly, and which subgroup might be missed because its risk is less visible in administrative data?
References
- Kitchen C, Belouali A, Nestadt PS, Wilcox HC, Kharrazi H. Evaluating the role of cost and fairness in machine learning models of suicide risk. Scientific Reports. 2026. doi:10.1038/s41598-026-50095-z
- Belsher BE, Smolenski DJ, Pruitt LD, et al. Prediction models for suicide attempts and deaths: a systematic review and simulation. JAMA Psychiatry. 2019;76(6):642-651. doi:10.1001/jamapsychiatry.2019.0174
- Simon GE, Johnson E, Lawrence JM, et al. Predicting suicide attempts and suicide deaths following outpatient visits using electronic health records. American Journal of Psychiatry. 2018;175(10):951-960. doi:10.1176/appi.ajp.2018.17101167
- Barak-Corren Y, Castro VM, Nock MK, et al. Validation of an electronic health record-based suicide risk prediction modeling approach across multiple health care systems. JAMA Network Open. 2020;3(3):e201262. doi:10.1001/jamanetworkopen.2020.1262
- McCarthy JF, Bossarte RM, Katz IR, et al. Predictive modeling and concentration of the risk of suicide: implications for preventive interventions in the US Department of Veterans Affairs. American Journal of Public Health. 2015;105(9):1935-1942. doi:10.2105/AJPH.2015.302737
- Saito T, Rehmsmeier M. The precision-recall plot is more informative than the ROC plot when evaluating binary classifiers on imbalanced datasets. PLoS One. 2015;10(3):e0118432. doi:10.1371/journal.pone.0118432
- Coppersmith DDL, Kleiman EM, Millner AJ, et al. Heterogeneity in suicide risk: evidence from personalized dynamic models. Behaviour Research and Therapy. 2024;180:104574. doi:10.1016/j.brat.2024.104574
- Kitchen CA, Belouali A, Nestadt PS, Wilcox HC, Kharrazi H. Navigating extreme class imbalance in suicide risk prediction. Frontiers in Psychiatry. 2025;16:1679618. doi:10.3389/fpsyt.2025.1679618