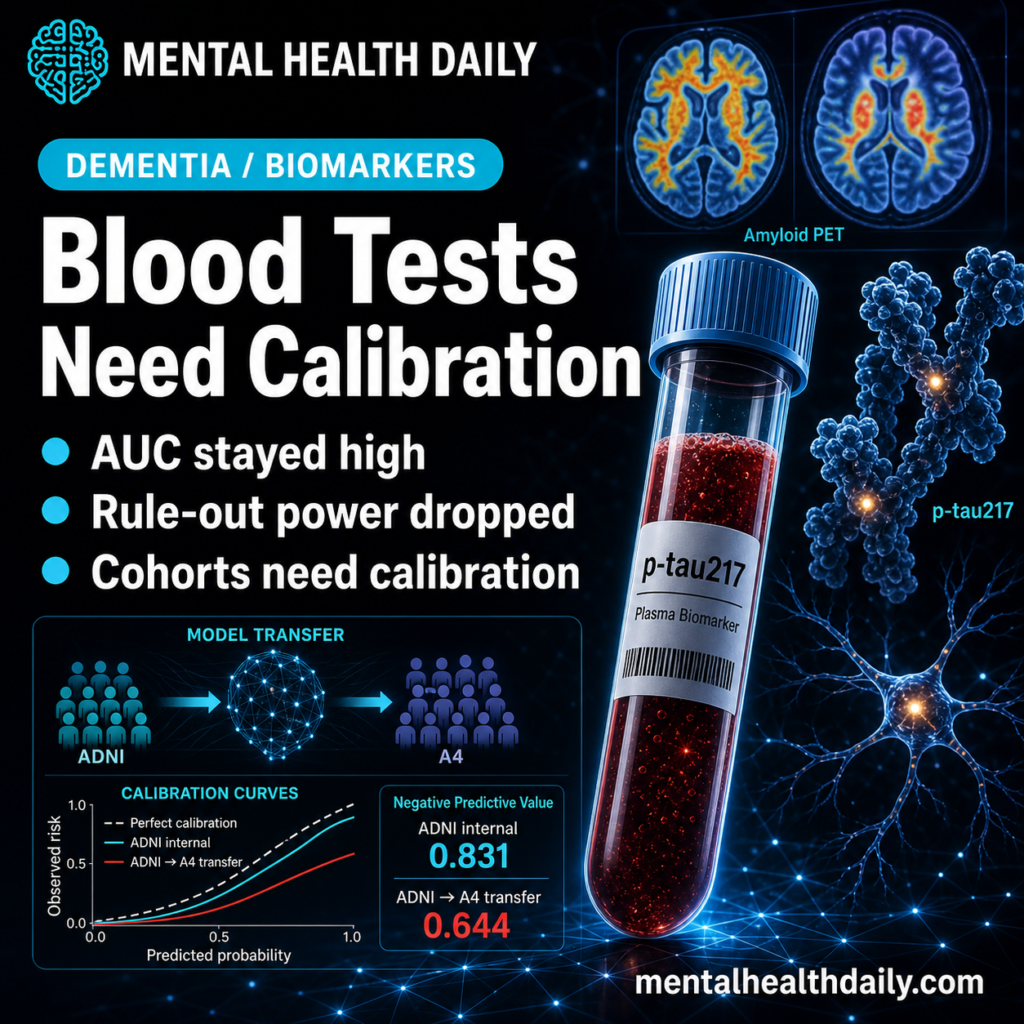
A 2026 ADNI/A4 validation study found that Alzheimer’s plasma-biomarker machine-learning models still ranked amyloid PET status well across cohorts, but the practical rule-out number moved hard: negative predictive value fell from 0.831 inside ADNI to 0.644 when the ADNI-trained model was applied to A4.1
Research Highlights
- 1,707-person ADNI/A4 test: researchers trained amyloid PET prediction models in ADNI (n = 885) and A4 (n = 822), then transferred them across cohorts without retraining.1
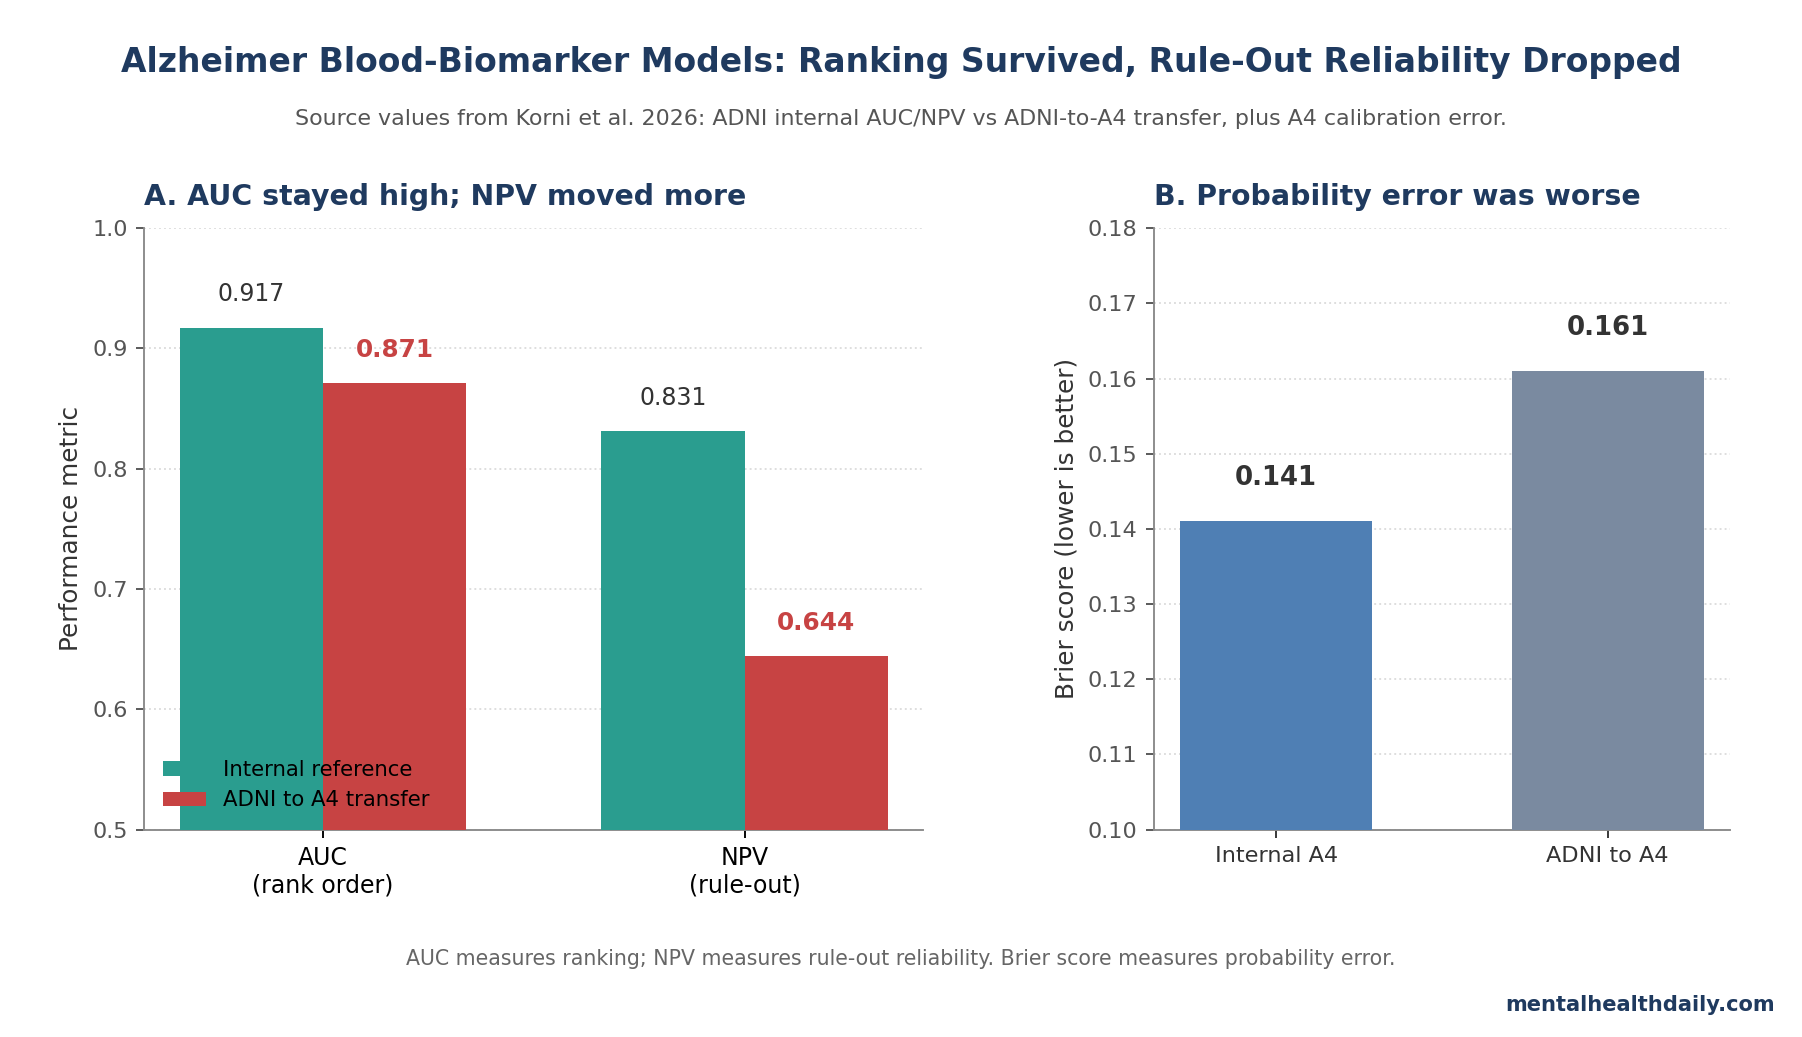
- AUC loss looked modest: ADNI internal amyloid classification reached AUC 0.913, while ADNI→A4 transfer remained around AUC 0.871, an absolute drop near 0.046.1
- Rule-out reliability fell more: negative predictive value (the chance that a negative screen truly means no amyloid positivity) dropped from 0.831 to 0.644 under ADNI→A4 transfer.1
- Calibration was the weak point: cross-cohort deployment produced probability misestimation, with ADNI→A4 Brier score 0.161 vs. 0.141 for internal A4 calibration.1
- The biomarker signal did not disappear: p-tau217, Aβ42/40, and APOE-ε4 remained biologically coherent predictors, but assay distribution, prevalence, and cohort mix changed how scores translated into decisions.1
The useful correction is not “Alzheimer’s blood tests failed.” It is sharper: high discrimination can survive a cohort shift while rule-out decisions become less dependable.
Plasma p-tau217 is a blood measure of phosphorylated tau 217, a tau-related Alzheimer’s biomarker that rises with amyloid and tau pathology. Calibration means predicted probabilities match observed rates; a model is poorly calibrated when a predicted 20% risk does not behave like a 20% risk in the population where it is used.
ADNI and A4 Asked Different Deployment Questions
Korni et al. analyzed 2 well-known Alzheimer’s research cohorts with different clinical shapes.1 ADNI (Alzheimer’s Disease Neuroimaging Initiative) spans cognitively normal adults, mild cognitive impairment, and Alzheimer’s dementia. A4 (Anti-Amyloid Treatment in Asymptomatic Alzheimer’s Disease) is closer to a preclinical prevention-trial population: clinically normal older adults screened around amyloid status.
Those differences matter because a screening model is not used in the abstract. It is used in a population with a particular amyloid prevalence, assay platform, age distribution, symptom mix, and referral pattern.
- ADNI analytic sample: 885 participants with plasma biomarkers, covariates, and amyloid PET outcomes.
- A4 analytic sample: 822 participants with the same required outcome structure.
- Amyloid positivity: 46.5% in ADNI vs. 61.8% in A4.
- Biomarker inputs: p-tau217, Aβ40, Aβ42, Aβ42/40 ratio, GFAP, NfL, demographics, and APOE-ε4 status.
Negative predictive value (NPV) is central for screening because it asks the reader-facing question: if the blood-model screen is negative, how often is amyloid PET truly negative? NPV changes when the model moves into a population with different disease prevalence, even if the model’s ranking ability looks similar.9
AUC Stayed High While NPV Dropped
Within each cohort, the models looked strong. In ADNI, random forest classified amyloid PET status with AUC 0.913 and accuracy 0.845; in A4, logistic regression reached AUC 0.870 and accuracy 0.793.1 Continuous centiloid prediction was weaker but still meaningful, with best R² values of 0.628 in ADNI and 0.535 in A4.
The cross-cohort test changed the clinical read. When ADNI-trained models were deployed in A4, AUC declined only modestly, to roughly 0.83–0.87 across models. The best ADNI→A4 logistic model still had AUC 0.870824 and accuracy 0.774939.1
NPV moved more than AUC. Internal ADNI NPV was 0.831 (95% CI, 0.799–0.863). ADNI→A4 transfer lowered it to 0.644 (95% CI, 0.599–0.689), about a 19-percentage-point drop from the ADNI internal estimate.1
The reverse direction, A4→ADNI, produced NPV 0.865 (95% CI, 0.831–0.899). Korni et al. cautioned against reading that as a cleaner model, because NPV is shaped by sensitivity and amyloid prevalence in the target cohort. A higher NPV in a lower-prevalence setting can reflect base-rate arithmetic rather than better clinical calibration.1
Calibration Explains the Deployment Fragility
Probability estimates became less trustworthy when the model crossed cohorts. In ADNI→A4 deployment, predicted probabilities underestimated observed amyloid positivity in the low-to-intermediate probability range. Calibration metrics pointed in the same direction: slope 0.992, intercept 0.957, and Brier score 0.161 vs. internal A4 slope 0.941, intercept 0.033, and Brier score 0.141.1
Brier score is a probability-error measure where lower is better. It penalizes confident wrong predictions, so it is directly relevant when a screen is supposed to decide who can safely avoid PET or cerebrospinal-fluid testing.
This is the exact problem Van Calster et al. called the “Achilles heel” of prediction models: discrimination asks whether higher-risk people tend to rank above lower-risk people, while calibration asks whether the predicted probabilities are numerically usable.7 A model can rank people well and still give probabilities that drift when moved into a different measurement environment.
Health-AI dataset-shift work makes the same point from another angle. Subbaswamy and Saria described how models developed in one environment can lose reliability when the data-generating process changes, even if the causal biological signal remains present.8
Assay and Cohort Differences Shifted the Biomarker Scale
Korni et al. did not find that p-tau217 became biologically meaningless. Feature rankings and SHAP analyses kept p-tau217 as the dominant predictor, with APOE-ε4 and Aβ42/40 also behaving in the expected directions.1
The problem was translation across measurement contexts. Raw p-tau217 values differed sharply between cohorts: mean 0.363 in ADNI vs. 0.173 in A4 (Δ 0.189). Aβ42/40 also differed: 0.0576 in ADNI vs. 0.0929 in A4 (Δ −0.0353). Z-scoring aligned means inside each cohort, but distribution shape, variance, and skewness still differed.1
Head-to-head assay literature supports that caution. Janelidze et al. compared 10 plasma phospho-tau assays and found assay-dependent differences in performance.5 Warmenhoven et al. later compared key plasma p-tau217 tests directly, reinforcing that platform choice and calibration are not minor technical details once a blood test moves toward clinical decisions.6
Implementation guidance has been moving in the same direction. Hansson et al. recommended careful use of Alzheimer’s blood biomarkers rather than free-floating screening, and Teunissen et al. emphasized standardization, assay validation, and use-case definition before broad clinical implementation.2,3
Palmqvist et al. showed strong performance for automated plasma p-tau217 in primary and secondary care, but that kind of work is still setting-specific validation, not proof that every model threshold ports everywhere.4
What the Result Does and Does Not Support
This 2026 study is a preprint, not a peer-reviewed prospective deployment trial. It used retrospective ADNI and A4 data, baseline measurements, and bidirectional transfer without initial retraining or local recalibration.1 That design is useful precisely because it stress-tests portability, but it cannot prove how a commercial blood-test workflow would perform in a memory clinic, primary-care network, or trial-recruitment program after full local calibration.
Supported inference: plasma biomarker models can preserve high amyloid-PET discrimination across cohorts while losing clinically important rule-out reliability because calibration, assay distribution, and prevalence shift.
Unsupported inference: Alzheimer’s blood biomarkers are unusable. The p-tau217 and Aβ42/40 signal remained coherent, and adjacent clinical literature still supports blood biomarkers as triage tools when local assay thresholds and confirmatory pathways are defined.2,3,4
Practical implementation: model reports should include AUC, calibration plots, Brier score, PPV, NPV, prevalence, assay platform, and an external-validation cohort that resembles the intended deployment site. AUC alone is too thin for a rule-out claim.
For clinicians, the practical question is whether a negative result safely changes the next step. If confirmatory PET, cerebrospinal-fluid testing, or repeat biomarker testing remains necessary, the model is a triage aid rather than a rule-out endpoint.
For trial recruitment, the same calibration problem can waste scans and exclude the wrong people if the model threshold is imported from another cohort unchanged.
Questions About Alzheimer’s Blood Biomarker Models
Does this mean plasma p-tau217 is unreliable?
No. Plasma p-tau217 remained the dominant predictor in the Korni analysis, and multiple external studies support its diagnostic value for Alzheimer’s pathology.1,4,6
The narrower message is that a p-tau217-based model needs calibration in the population and assay environment where it will be used.
Why can AUC look good while NPV falls?
AUC measures ranking: amyloid-positive people generally score higher than amyloid-negative people. NPV measures a decision result: after a negative screen, how often is the person truly amyloid-negative?
NPV changes with prevalence and threshold behavior. A model can rank people fairly well but still give less dependable rule-out decisions when moved into a cohort with a different amyloid base rate.
Should a negative blood-biomarker screen rule out Alzheimer’s pathology?
Only if the test has been validated for that clinical setting, assay platform, and intended population. For treatment decisions or borderline results, PET or cerebrospinal-fluid confirmation may still be necessary.
What should researchers report before claiming deployment readiness?
External validation, calibration, prevalence, predictive values, assay platform, threshold selection, and net clinical benefit. Discrimination is necessary, but the Korni data show it is not sufficient for rule-out screening.
References
- Cross-Cohort Generalizability of Plasma Biomarker Machine Learning Models Reveals Calibration-Driven Degradation in Clinical Utility. Korni A, Zandi E. medRxiv. 2026 (preprint). doi:10.64898/2026.04.09.26350514
- The Alzheimer’s Association appropriate use recommendations for blood biomarkers in Alzheimer’s disease. Hansson O et al. Alzheimer’s & Dementia. 2022;18:2669-2686. doi:10.1002/alz.12756
- Blood-based biomarkers for Alzheimer’s disease: towards clinical implementation. Teunissen CE et al. Lancet Neurology. 2022;21:66-77. doi:10.1016/s1474-4422(21)00361-6
- Plasma phospho-tau217 for Alzheimer’s disease diagnosis in primary and secondary care using a fully automated platform. Palmqvist S et al. Nature Medicine. 2025;31:2036-2043. doi:10.1038/s41591-025-03622-w
- Head-to-head comparison of 10 plasma phospho-tau assays in prodromal Alzheimer’s disease. Janelidze S et al. Brain. 2023;146:1592-1601. doi:10.1093/brain/awac333
- A comprehensive head-to-head comparison of key plasma phosphorylated tau 217 biomarker tests. Warmenhoven N et al. Brain. 2025;148:416-431. doi:10.1093/brain/awae346
- Calibration: the Achilles heel of predictive analytics. Van Calster B et al. BMC Medicine. 2019;17:230. doi:10.1186/s12916-019-1466-7
- From development to deployment: dataset shift, causality, and shift-stable models in health AI. Subbaswamy A, Saria S. Biostatistics. 2020;21:345-352. doi:10.1093/biostatistics/kxz041
- Diagnostic tests 2: Predictive values. Altman DG, Bland JM. BMJ. 1994;309:102. doi:10.1136/bmj.309.6947.102