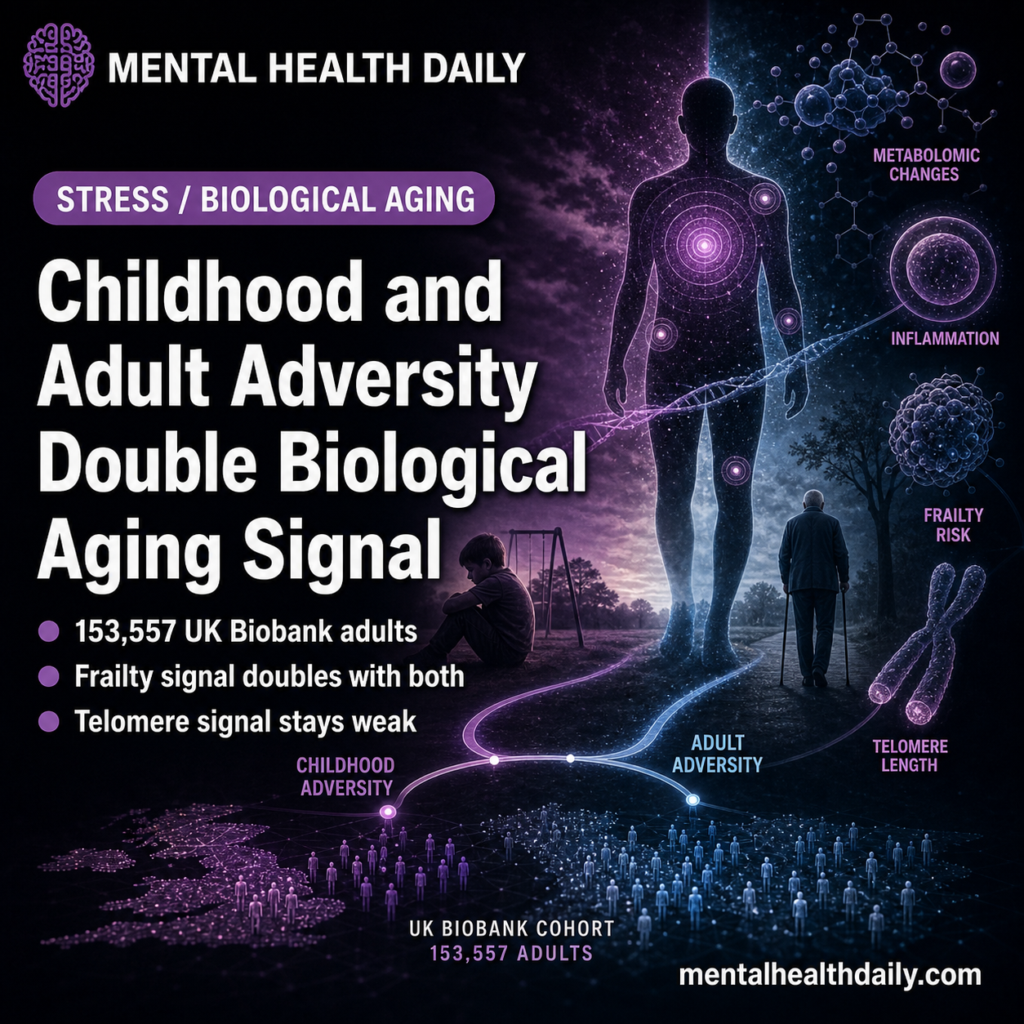
A 2026 UK Biobank analysis by Aas et al. in BMC Medicine tests the “adversity leaves a fixed biological scar” framing against five biological aging markers in 153,557 middle-aged and older adults — and the marker that moves most reliably isn’t telomere length or any metabolomic clock.1
Research Highlights
- 153,557-participant test: Aas et al. measured childhood adversity against five aging markers: metabolomic age (MileAge) delta, a metabolomic mortality profile, a frailty index, leukocyte telomere length, and grip strength.1
- Frailty carried the signal: childhood adversity standardized β = 0.284 (95% confidence interval [CI] 0.276–0.293, p < 0.001); adulthood adversity β = 0.233 (0.224–0.242); both periods together β = 0.434 (0.422–0.445).1
- Cumulative exposure mattered: the 40,086 participants exposed in both childhood and adulthood were the only group with metabolite-predicted age exceeding chronological age (MileAge delta β = 0.028, 95% CI 0.008–0.048, p = 0.021).1
- Telomere signal was small: childhood adversity predicted shorter telomeres weakly (β = 0.014, p = 0.015), while adulthood adversity alone was not detectable — consistent with broader literature finding weaker telomere effects than early claims suggested.3,4
- Abuse outweighed neglect: abuse predicted aging markers more consistently than neglect, while adulthood physical abuse paradoxically tracked with higher grip strength (β = −0.022, p < 0.001).1
The popular framing of childhood adversity has hardened around a single image: trauma in early life leaves a permanent biological scar that shows up decades later in shorter telomeres, faster epigenetic clocks, and earlier disease.2
Aas data are more specific. Childhood and adulthood adversity both predicted worse aging markers, but the strongest association landed on accumulated health deficits, and stacking exposure across both life stages roughly doubled the effect compared with either life stage alone.
The narrower claim is stronger than the fixed-scar frame: adversity at any life stage shows up in midlife health-deficit accumulation, abuse hits harder than neglect, and combined exposure roughly doubles the frailty-index association.
Aas 2026: 153,557 Participants, Five Aging Markers, Lifespan Exposure Mapping
The design is large-cohort observational. UK Biobank participants completed the baseline biomarker visit between 2006 and 2010 and an online mental health questionnaire between 2016 and 2017.
Exposure measurement: childhood adversity used the 5-item Childhood Trauma Screener covering emotional neglect, emotional abuse, physical abuse, sexual abuse, and physical neglect.5 Adulthood adversity used 5 items from the British Crime Survey covering emotional neglect, emotional abuse, physical abuse, sexual abuse, and economic hardship since age 16.1
The five biological aging outcomes span distinct levels of biology:
- MileAge delta — a metabolomic clock trained on chronological age using nuclear magnetic resonance (NMR) spectroscopy of 249 plasma biomarkers. Positive values mean metabolite-predicted age exceeds actual age.6
- Metabolomic mortality profile — a separate NMR score trained directly on all-cause mortality risk in 234,553 participants.7
- Frailty index — sum of 49 health-deficit indicators across cardiometabolic, immunological, musculoskeletal, sensory, and well-being domains, divided by total possible deficits.8
- Leukocyte telomere length — telomere-to-single-copy gene (T/S) ratio measured by quantitative polymerase chain reaction (qPCR).9
- Grip strength — maximal kilogram-force on a hydraulic dynamometer for the dominant hand.
All outcomes were standardized to mean zero and standard deviation (SD) 1, so the standardized beta coefficients compare effect sizes across different measurement scales. Telomere length and grip strength were reverse-coded so positive betas always mean “older / weaker.” Models adjusted for chronological age, sex, education, household income, ethnicity, and Townsend deprivation index. P-values use Benjamini-Hochberg correction at a false discovery rate (FDR) of 5%.1
Frailty Index Carries the Main Association
The strongest pattern in the data is one most coverage of childhood-adversity research underplays: the marker that moves most isn’t telomere length or any metabolomic clock. It’s the frailty index — the simplest, most intuitive of the five outcomes.
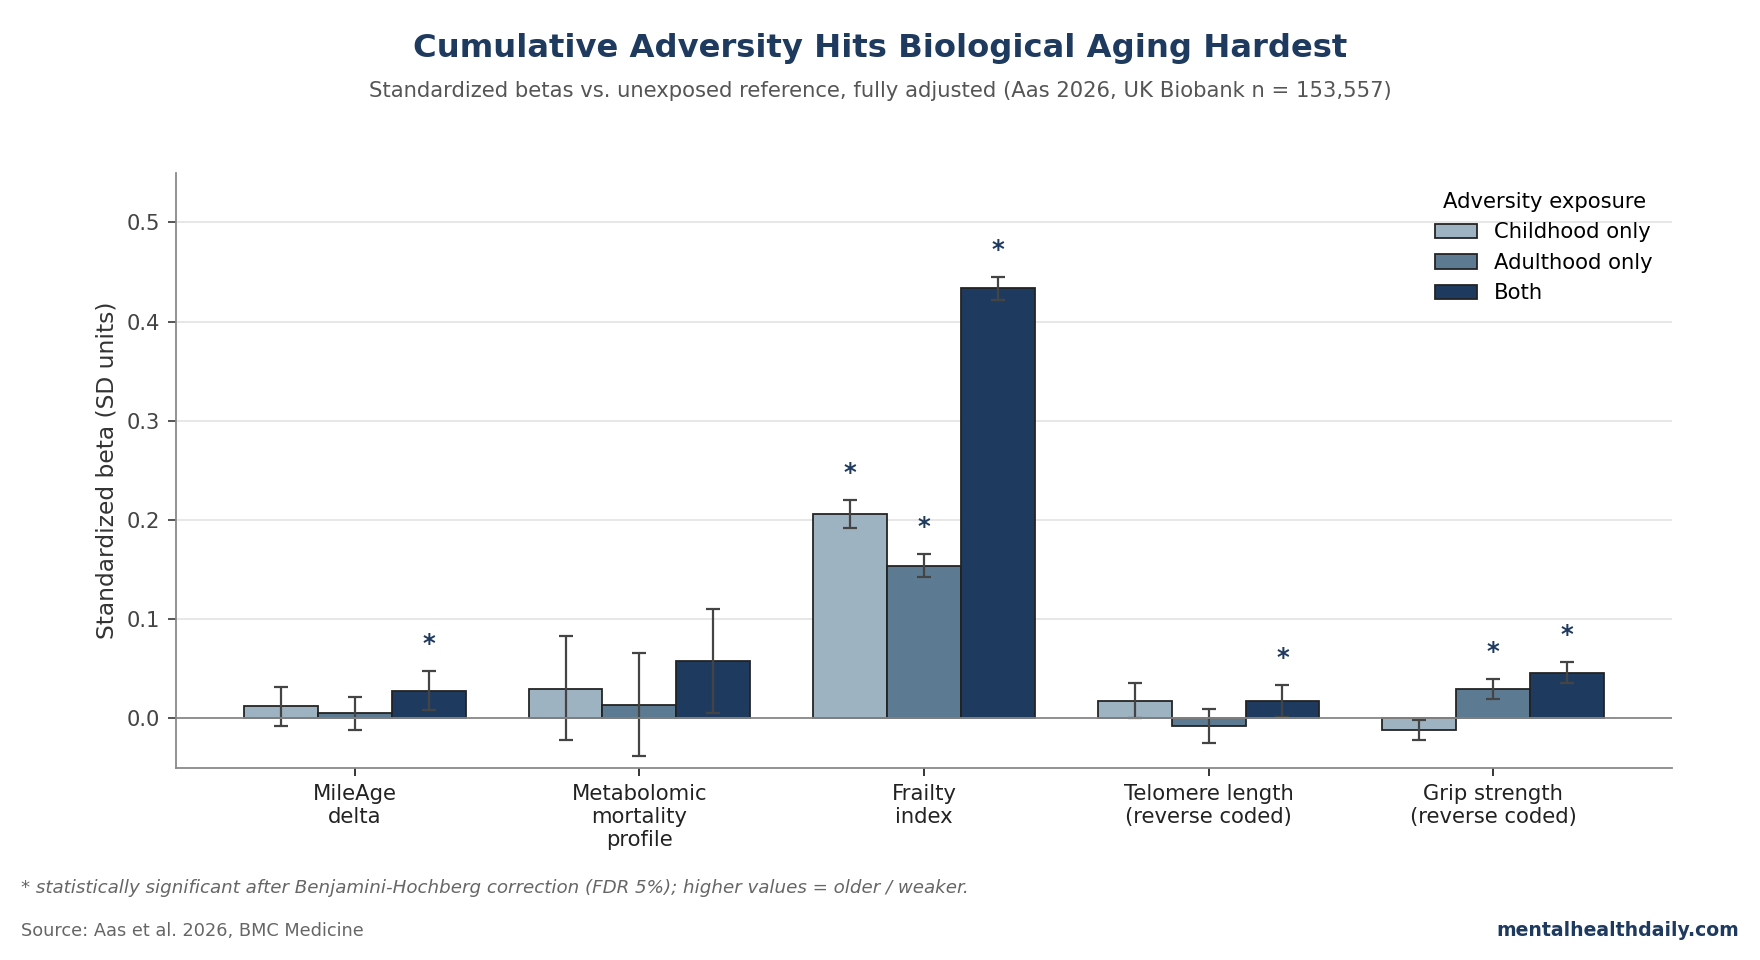
For binary exposure (any childhood adversity yes/no), the fully adjusted frailty index association is β = 0.284 (95% CI 0.276–0.293, p < 0.001). For adulthood adversity, β = 0.233 (0.224–0.242, p < 0.001).1 Compare the same exposures against the other four markers in the fully adjusted models:
- MileAge delta: Childhood β = 0.020, p = 0.018; adulthood β = 0.011, p = 0.191 (non-significant).
- Metabolomic mortality profile: Childhood β = 0.038, p = 0.152; adulthood β = 0.054, p = 0.065 — both fail multiple-testing correction.
- Telomere length (reverse coded): Childhood β = 0.014, p = 0.015; adulthood β = −0.002, p = 0.793 (no detectable association).
- Grip strength (reverse coded): Childhood β = 0.006, p = 0.104 (no detectable association); adulthood β = 0.042, p < 0.001.
The frailty association is roughly an order of magnitude larger than the other markers. This isn’t because frailty is over-sensitive — it’s because the frailty index pools 49 distinct deficits, so an adversity effect that touches multiple body systems aggregates more cleanly than any single biomarker. The metabolomic and telomere markers are noisier per unit of adversity-related effect.
The popular framing often points to “biological embedding” through specific molecular machinery — epigenetic clocks, telomere attrition, inflammatory dysregulation.2,10 The Aas data say that machinery is detectable but small at population scale; the strong, replicable adversity effect is on accumulated health deficits, which is closer to the original ACE-study endpoint anyway.2
Cumulative Exposure Roughly Doubles the Frailty Association
The cross-classification analysis — childhood only, adulthood only, both, or neither — is where the paper earns its title. Of 148,184 participants with complete data on both periods, 40,086 (27.1%) reported adversity in childhood and adulthood.1
For the frailty index, betas (vs. neither-exposed) climb in steps:
- Childhood only: β = 0.206 (95% CI 0.192–0.220, p < 0.001).
- Adulthood only: β = 0.154 (0.143–0.166, p < 0.001).
- Both: β = 0.434 (0.422–0.445, p < 0.001) — about double either alone.
The doubling is interesting because it’s consistent with simple additive effects rather than synergy. If childhood and adulthood adversity were biologically interchangeable, you’d expect either-only to look about half of both-exposed; that’s roughly what the data show. The two windows of exposure do not appear to interact multiplicatively — they accumulate.
The other notable cumulative-exposure result: MileAge delta only crosses statistical significance in the both-stages group (β = 0.028, 95% CI 0.008–0.048, p = 0.021).1 Childhood-only and adulthood-only groups don’t move the metabolomic clock detectably. The metabolomic-clock effect is small enough that you need cumulative exposure to lift it above noise, even in a sample of 40,000+.
For the highest dose — 5 of 5 childhood adverse events — the frailty beta climbs to 0.925 (95% CI 0.869–0.981), and adulthood 5-of-5 reaches 0.831 (0.780–0.882).1 Those are large standardized effects by any conventional rule of thumb — the equivalent of being roughly a full SD frailtier than an unexposed peer.
Why Abuse Hits Harder Than Neglect (and the Counterintuitive Physical-Abuse-Grip Result)
Item-level analysis lets the paper rank specific exposures. Across both childhood and adulthood, abuse items associate more strongly with biological aging markers than neglect or hardship items. Two patterns deserve flagging.
Childhood emotional abuse predicts MileAge delta where neglect doesn’t. β = 0.036 (95% CI 0.015–0.056, p = 0.002) for emotional abuse on metabolite-predicted age, while neglect items don’t reach significance.1 The implication: not all childhood adversity carries the same metabolomic signature. Active abuse appears more biologically embedded than the absence of care.
Adulthood physical abuse paradoxically tracks with higher grip strength. β = −0.022 (95% CI −0.030 to −0.014, p < 0.001) — statistically tight and pointing the “wrong” way.1 Aas et al. speculated this reflects a compensatory defensive mechanism: adults experiencing physical violence may build muscle as protection or survival adaptation.
The grip-strength result should be read as proxy noise, not protection. Grip strength can move through pathways unrelated to aging biology when an exposure changes defensive behavior or physical activity. Frailty index, with its 49-item base, washes out that kind of single-channel artifact.
Telomere exception: adulthood physical abuse does predict shorter telomeres after full adjustment (β = 0.020, 95% CI 0.005–0.035, p = 0.025) — the only adulthood adversity item that does so.1
This fits a small literature suggesting acute physical trauma uniquely engages telomere-shortening pathways, where chronic neglect or hardship may not.11
Where Aas Fits Against ACE-Study and Earlier UK Biobank Work
Earlier UK Biobank work on childhood adversity alone tied trauma exposure to higher allostatic load in females (Jakubowski 2023), to clinical biomarker-based aging indices like PhenoAge exceeding chronological age (Yang 2022), to greater multimorbidity (Hanlon 2020), and to higher frailty odds (Yang 2024).12,13,14,15 Aas extends those findings by adding adulthood exposure, the cross-classification, and the NMR-based metabolomic clocks not previously tested in this cohort.
The original ACE study by Felitti et al. in 1998 established the dose-response between childhood adverse experiences and adult disease risk in 17,337 Kaiser members.2 Aas’ findings track the ACE template: a graded relationship between adversity count and worse health markers.
Modern aging-biomarker readouts let the question shift from “does adversity predict disease” to “through what biological windows can we see it.” The answer the data support: the frailty window clearly, the metabolomic window only with cumulative exposure, the telomere window weakly.
The Belsky 2015 methodological work on quantifying biological aging argued that any single biomarker is too noisy to track aging trajectories well; pooled multi-system indices outperform individual measures.16 Aas is functionally a five-marker test of that argument, and the 49-item frailty index dominating the four single-system biomarkers by an order of magnitude vindicates it.
Limitations of the Aas Analysis
Five caveats deserve weight:
- Cross-sectional design. The exposures and most outcomes are measured at points years apart, but the analysis can’t isolate when the biological aging signal accumulated. For adulthood adversity especially, some events may have occurred after the baseline biomarker assessment — reverse causation isn’t fully ruled out.1
- UK Biobank healthy-volunteer bias. The cohort is older, whiter, and healthier than the UK general population. Healthy-volunteer bias generally attenuates exposure-outcome associations — the real-world effects in less-selected populations may be larger than these standardized betas suggest.17
- Retrospective adversity self-report. Both questionnaires were filled out years after the events. Recall bias and underreporting are likely — though work by Danese and Widom 2023 found retrospective reports of childhood maltreatment predict adult mental-health outcomes about as well as prospectively measured exposures.18
- qPCR telomere measurement is the loose link. Quantitative PCR is the standard epidemiological method but doesn’t capture the count of critically short telomeres or cell-specific variation. A higher-resolution method might pull a stronger telomere signal out of the same cohort.9
- Sample restricted to middle-aged and older adults. UK Biobank participants were 40–69 at baseline. Effects on biological aging markers may look different in younger samples where adversity exposure is more recent and downstream disease accumulation hasn’t had decades to develop.1
The directional consistency across the five markers, the dose-response within each adversity sum score, and the doubling pattern in the cross-classification all argue the findings aren’t artifacts of any single methodological choice. But the absolute effect sizes for telomere length and the metabolomic mortality profile are small enough that future cohorts with different methods could narrow or widen them.
Frailty Outperforms Single Biomarkers in Adversity Research
Methodological implication: researchers picking a single biological aging marker to track adversity effects should weight the frailty index heavily — or build composite indices that pool deficits across systems. The single-marker telomere studies that dominated early adversity-and-aging work were fishing in a noisier channel than the field assumed.
On the substantive question, cumulative exposure moves the frailty index by roughly half a standard deviation; severe cumulative exposure (5 of 5 childhood items) moves it close to a full SD. At population scale and over decades, that translates into measurably more multimorbidity, earlier disability, and premature mortality.14,19
The strong “trauma writes itself permanently into biology” framing is too deterministic. The adversity-aging association is well-replicated, detectable, and cumulative — but it’s small per marker, and recent work suggests biological age can be partially restored after stress recovery.20 Adversity biology is a population-health burden signal, not an individual prognosis.
Questions About Adversity and Biological Aging
Does childhood trauma cause faster biological aging?
In observational data — including this UK Biobank analysis — childhood adversity tracks with measurably worse aging markers, especially the frailty index. The design can’t prove causation, but the dose-response across adversity counts and directional consistency across five biological domains make pure confounding hard to invoke. Per-marker effects are modest; cumulative exposure compounds them.1
Is the “telomeres get shorter from trauma” finding holding up?
Weaker than initially claimed. The Aas binary-exposure beta for childhood adversity on telomere length was 0.014 (p = 0.015); adulthood adversity didn’t reach significance. Epel 2004 and follow-ups in clinical samples found larger effects, but population-scale UK Biobank data suggest telomere length is a noisier biomarker for adversity than originally thought.3,4,1
Why did physical abuse in adulthood predict higher grip strength?
Aas et al. speculated it reflects a defensive or survival adaptation — adults facing physical violence may build muscle through protective behavioral pathways unrelated to aging biology. The finding shows why single biomarkers can move through channels unrelated to the construct they’re meant to measure. The 49-item frailty index washes out that kind of single-channel artifact.1
Does the frailty index measure aging or just disease accumulation?
Both, deliberately. A frailty index counts accumulated health deficits across cardiometabolic, immunological, musculoskeletal, sensory, and mental-health domains. That accumulation is itself the most clinically meaningful definition of biological aging at the whole-organism level. Aas argues this composite outperforms any single-system biomarker for adversity research.8,16
Can biological aging from adversity be reversed?
Poganik 2023 in Cell Metabolism showed biological age can rise during acute stress (surgery, severe COVID-19) and then decline after recovery, arguing for at least partial reversibility on epigenetic markers. Whether decades-old adversity-driven aging patterns reverse at the same scale is unsettled, but the direction is encouraging. Frailty itself is a recognized intervention target through exercise, nutrition, and chronic-disease management.20,8
References
- Adverse events in both childhood and adulthood are associated with molecular, clinical and functional markers of ageing. Aas M, Hoppen TH, Morina N, Zhang S, Li B, Mlakar V, Mutz J. BMC Medicine. 2026;24:252. doi:10.1186/s12916-026-04815-x
- Relationship of childhood abuse and household dysfunction to many of the leading causes of death in adults. The Adverse Childhood Experiences (ACE) Study. Felitti VJ, Anda RF, Nordenberg D, et al. American Journal of Preventive Medicine. 1998;14(4):245–258. doi:10.1016/s0749-3797(98)00017-8
- Accelerated telomere shortening in response to life stress. Epel ES, Blackburn EH, Lin J, et al. Proceedings of the National Academy of Sciences. 2004;101(49):17312–17315. doi:10.1073/pnas.0407162101
- Child maltreatment and telomere length in middle and older age: retrospective cohort study of 141,748 UK Biobank participants. Zhou Z, Lo CKM, Chan KL, et al. British Journal of Psychiatry. 2023;223(2):377–381. doi:10.1192/bjp.2023.86
- The Childhood Trauma Screener (CTS) — development and validation of cut-off-scores for classificatory diagnostics. Glaesmer H, Schulz A, Häuser W, Freyberger HJ, Brähler E, Grabe HJ. Psychiatrische Praxis. 2013;40(4):220–226. doi:10.1055/s-0033-1343116
- Metabolomic age (MileAge) predicts health and life span: a comparison of multiple machine learning algorithms. Mutz J, Iniesta R, Lewis CM. Science Advances. 2024;10(51):eadp3743. doi:10.1126/sciadv.adp3743
- A metabolomic profile of biological aging in 250,341 individuals from the UK Biobank. Zhang S, Wang Z, Wang Y, et al. Nature Communications. 2024;15(1):8081. doi:10.1038/s41467-024-52310-9
- A frailty index for UK Biobank participants. Williams DM, Jylhävä J, Pedersen NL, Hägg S. Journals of Gerontology Series A. 2019;74(4):582–587. doi:10.1093/gerona/gly094
- Method comparison studies of telomere length measurement using qPCR approaches: a critical appraisal of the literature. Lindrose AR, McLester-Davis LWY, Tristano RI, et al. PLoS ONE. 2021;16(1):e0245582. doi:10.1371/journal.pone.0245582
- Traumatic stress and accelerated DNA methylation age: a meta-analysis. Wolf EJ, Maniates H, Nugent N, et al. Psychoneuroendocrinology. 2018;92:123–134. doi:10.1016/j.psyneuen.2017.12.007
- Telomere length is associated with childhood trauma in patients with severe mental disorders. Aas M, Elvsåshagen T, Westlye LT, et al. Translational Psychiatry. 2019;9(1):97. doi:10.1038/s41398-019-0432-7
- Association between adverse childhood experiences and later-life allostatic load in UK Biobank female participants. Jakubowski D, Peterson CE, Sun J, et al. Women’s Health. 2023;19:17455057231184325. doi:10.1177/17455057231184325
- Association of unhealthy lifestyle and childhood adversity with acceleration of aging among UK Biobank participants. Yang G, Cao X, Li X, et al. JAMA Network Open. 2022;5(9):e2230690. doi:10.1001/jamanetworkopen.2022.30690
- Association between childhood maltreatment and the prevalence and complexity of multimorbidity: a cross-sectional analysis of 157,357 UK Biobank participants. Hanlon P, McCallum M, Jani BD, et al. Journal of Comorbidity. 2020;10:2235042X10944344. doi:10.1177/2235042×10944344
- Association of childhood adversity with frailty and the mediating role of unhealthy lifestyle: a lifespan analysis. Yang G, Cao X, Yu J, et al. American Journal of Geriatric Psychiatry. 2024;32(1):71–82. doi:10.1016/j.jagp.2023.08.015
- Quantification of biological aging in young adults. Belsky DW, Caspi A, Houts R, et al. Proceedings of the National Academy of Sciences. 2015;112(30):E4104–E4110. doi:10.1073/pnas.1506264112
- Comparison of sociodemographic and health-related characteristics of UK Biobank participants with those of the general population. Fry A, Littlejohns TJ, Sudlow C, et al. American Journal of Epidemiology. 2017;186(9):1026–1034. doi:10.1093/aje/kwx246
- Associations between objective and subjective experiences of childhood maltreatment and the course of emotional disorders in adulthood. Danese A, Widom CS. JAMA Psychiatry. 2023;80(10):1009–1016. doi:10.1001/jamapsychiatry.2023.2140
- Frailty in individuals with depression, bipolar disorder and anxiety disorders: longitudinal analyses of all-cause mortality. Mutz J, Choudhury U, Zhao J, Dregan A. BMC Medicine. 2022;20(1):274. doi:10.1186/s12916-022-02474-2
- Biological age is increased by stress and restored upon recovery. Poganik JR, Zhang B, Baht GS, et al. Cell Metabolism. 2023;35(5):807–820.e5. doi:10.1016/j.cmet.2023.03.015