
A 2025 paper by Gu et al. in Molecular Psychiatry — the largest study of its kind — finds that higher common-variant genetic risk for autism predicts lower cortical neurite density in 31,748 UK Biobank adults and 4,928 ABCD children.1 The effect is small in absolute terms but replicates across cohorts and methods.
Research Highlights
- Large imaging-genetics sample: Gu et al. tested autism polygenic score (PGS) brain associations in 31,748 UK Biobank adults and 4,928 ABCD children.1
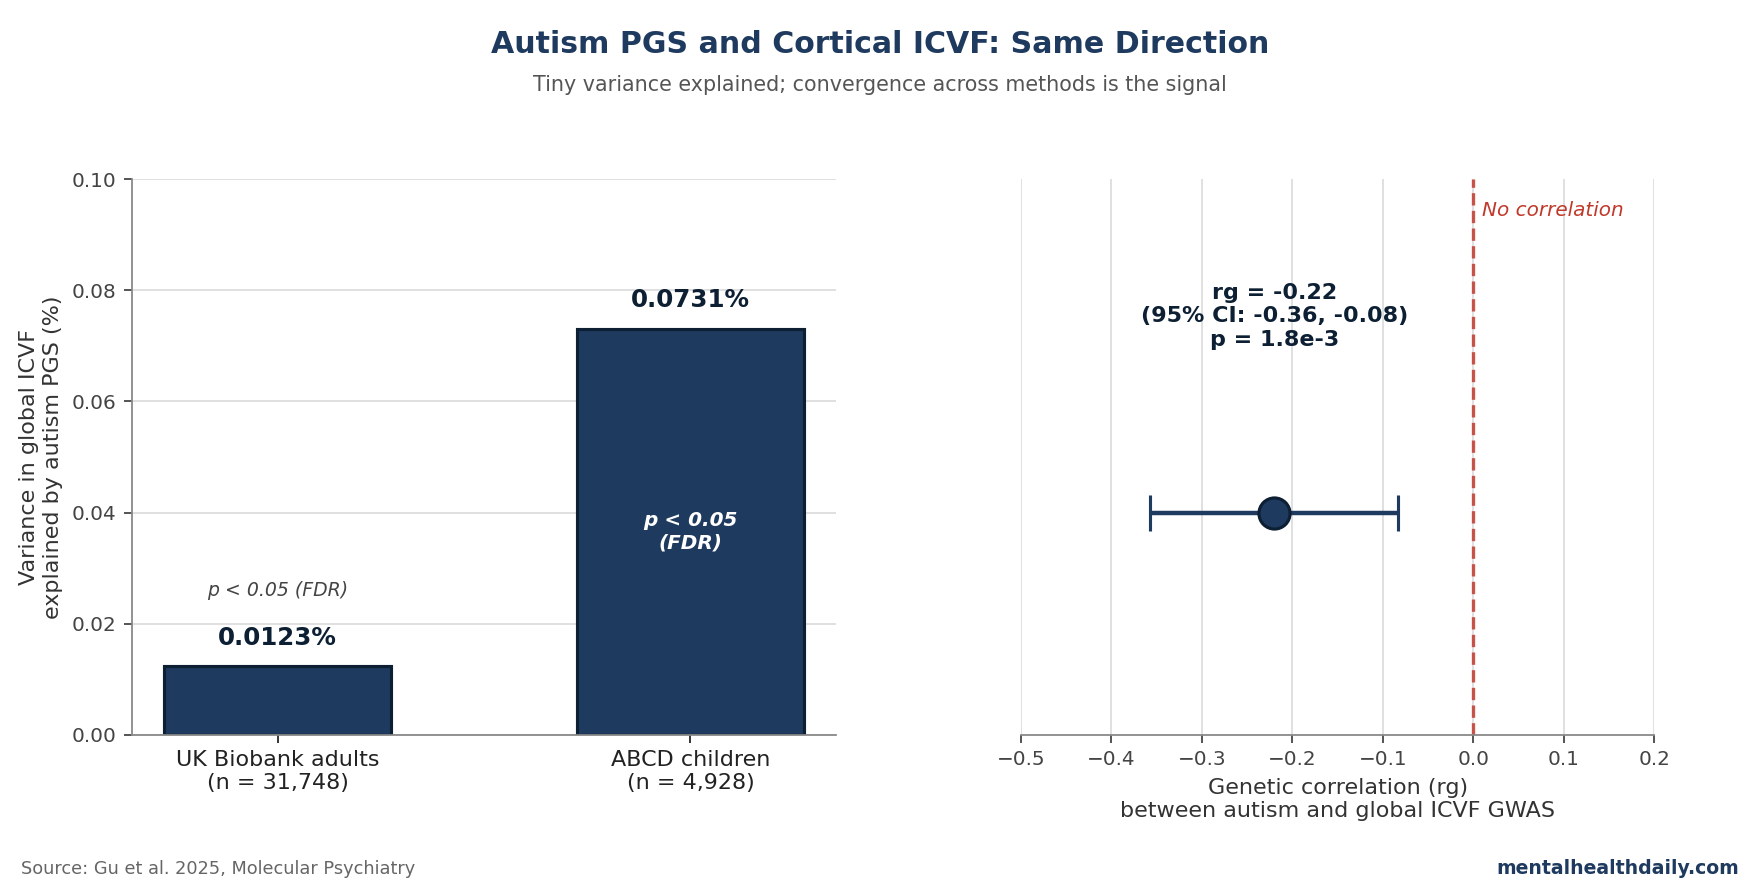
- Lower neurite-density signal: Higher autism PGS was associated with lower global ICVF (neurite density) in adults (R² = 1.23×10⁻⁴) and children (R² = 7.31×10⁻⁴).1
- Independent genetic confirmation: Autism and global ICVF had a genetic correlation of rg = −0.22 (SE 0.07, p = 1.8×10⁻³), pointing in the same direction by a different method.1
- White-matter extension: The negative association extended to 22 of 27 major white-matter tracts in UK Biobank, though tract-level evidence was weaker than cortical evidence.1
- Clinical utility stays near zero: Variance explained was tiny in absolute terms, so the signal is biologically interesting but not useful as an individual autism test.2
Coverage of polygenic-score (PGS) studies in psychiatry tends to slide into one of two failure modes: the headline-grabbing “genes for autism shrink the brain” framing, or the dismissive “PGS explains less than 1% of variance, so it’s noise.”
The Gu paper lands somewhere harder to caricature. Neurite density (the packing of axons and dendrites in the cortex) was measured via the diffusion-MRI metric ICVF, and the autism-PGS effect was the same direction in both cohorts, replicated with an independent method (genetic correlation, rg = −0.22), and survived FDR correction.
The intuition most readers bring to PGS-imaging studies is wrong in two opposite ways. The first is that “genes for autism” map cleanly onto brain features the way Mendelian variants for Huntington’s map to striatal degeneration; in fact, autism PGS is built from the additive effect of thousands of common variants and explains only 1% to 2% of variance in autism diagnosis itself.3
The second is that because variance explained is tiny, the signal is meaningless. With samples in the tens of thousands, fractional-percent effects can be statistically robust and converge with case-control imaging findings — the headline is overstated and the underlying signal is well-supported.
Negative Association Between Autism PGS and Cortical ICVF in Adults and Children
Gu et al. built polygenic scores using PRS-CS from the iPSYCH autism GWAS (19,870 autistic and 39,078 non-autistic participants).4 Five MRI-derived global phenotypes were tested: surface area, cortical thickness, mean curvature, intracellular volume fraction (ICVF, a NODDI-derived measure of neurite density also called Neurite Density Index or NDI), and isotropic volume fraction (a measure of free water).5
In UK Biobank adults, autism PGS was significantly associated with three of the five global phenotypes after FDR correction: lower surface area (R² = 1.23×10⁻⁴), lower ICVF (R² = 1.23×10⁻⁴), and higher cortical thickness (R² = 2.10×10⁻⁴).1 In ABCD children, the same direction held for ICVF (R² = 7.31×10⁻⁴).
Regionally in UK Biobank, the negative ICVF association reached significance in nine cortical regions concentrated in frontal and temporal lobes. ABCD children showed the same direction in eight regions, but in different locations — primarily occipital cortex.
Neurite density rises through childhood, plateaus in young adulthood, and declines in later life.6 Appearance of the autism-PGS signal in both cohorts suggests a developmental trajectory rather than a late-life process.
Genetic Correlation Confirms the Direction Independently of PGS
PGS analyses are vulnerable to a specific critique: a polygenic score is a noisy summary of GWAS effects, and any association it shows might be driven by quirks of the score rather than shared biology. Gu’s team addressed this by running LD score regression genetic correlation (LDSC) between autism and ICVF GWAS summary statistics — a method that uses the full GWAS, not a constructed score.7
The result: rg = −0.22 (SE 0.07, p = 1.8×10⁻³) for global ICVF, with significant negative correlations in 15 of the 17 regions where the PGS analysis flagged ICVF differences.1 Same direction, same anatomy, different method: the pattern looks less like an artifact of one analytic pipeline.
By contrast, surface area, mean curvature, and isotropic volume fraction did not show significant genetic correlations with autism after FDR correction. The PGS hits for those phenotypes — including the surface-area finding in 24 UK Biobank regions — didn’t survive the second method’s test. ICVF is the only phenotype where both methods agree.
The cortical-ICVF finding extended into white matter: 22 of 27 major tracts in UK Biobank showed significant negative PGS associations.1 But the white-matter result didn’t replicate in genetic correlation, so the tract-level findings are weaker evidence than the cortical findings.
Why R² Stays Small Despite Statistical Robustness
The variance-explained values — 0.01% for cortical ICVF in adults, around 0.07% in children — will look unimpressive beside height GWAS (~25%) or autism diagnosis itself (~1% to 2%). Three points keep the scale honest:
- PGS-brain associations are reliably small across psychiatry. Schizophrenia PGS explains less than 1% of variance in cortical thickness or ICVF in similar samples; depression PGS results are comparable.2,8
- Sample size, not effect size, drives statistical robustness here. With n = 31,748, even an R² of 0.01% can clear FDR correction. A previous study with fewer than 2,500 participants would have missed the signal entirely. Gu’s contribution isn’t a larger effect — it’s sufficient sample to detect the small effect that was always there.
- Genetic correlation captures more shared variance than any single PGS. The rg = −0.22 says something different from R²: that across the genome, common variants influencing autism overlap meaningfully with common variants influencing neurite density. The polygenic score is a noisy snapshot of that overlap; the genetic correlation is closer to the underlying biology.7
Clinical translation is therefore essentially zero. Nobody is going to predict autism or recommend an intervention from an individual’s neurite density. The value is biological mapping in samples large enough to see small effects.
Convergence with Case-Control Imaging — and a Transdiagnostic Caveat
Two prior literatures put Gu’s result in context. The case-control imaging tradition has identified diffusion-MRI differences in autistic vs. non-autistic individuals for over a decade, often pointing to altered white-matter integrity and reduced connectivity in specific tracts.9,10
Postmortem work in small samples has reported cortical disorganization and reduced minicolumn density.11 Gu’s general-population PGS finding aligns with both on direction and anatomical breadth.
Reduced ICVF is not specific to autism. Schizophrenia PGS shows a similar negative association with ICVF, and the autism-PGS and schizophrenia-PGS effects on ICVF correlate at r = 0.33 (95% CI 0.19–0.45).2
Reductions in NODDI-derived neurite density have also been reported in association with sleep, seizure, psychosis, and Parkinson’s disease.12 The signal Gu identifies might be a transdiagnostic marker of neurodevelopmental and psychiatric vulnerability rather than an autism-specific biomarker.
The calibrated read is narrower than the popular phrase “genes for autism reduce neurite density”:
- Supported: common-variant autism risk overlaps with common-variant influence on neurite density in large European-ancestry cohorts.
- Not supported: ICVF can identify autism in an individual brain scan, or reduced neurite density is unique to autism.
- Still open: the shared genetic signal may reflect upstream developmental biology that cuts across autism, schizophrenia, and other brain conditions.
The Mendelian randomization arm of the study (using genetic variants as natural-experiment instruments to test causation) returned no significant causal effect in either direction across 4 MR methods.13
The autism GWAS yields relatively few genome-wide significant SNPs, and MR is statistically demanding — the authors explicitly note the null “should be revisited using better powered instruments.”1 Shared common-variant genetics between autism and ICVF is well-supported; whether the relationship is causal vs. driven by upstream pleiotropy remains open.
Limitations of the Gu Synthesis
European ancestry only. Both cohorts were restricted to genetically inferred European ancestry, because polygenic scores transport poorly across populations.14 Whether the PGS-ICVF association generalizes to other ancestries is genuinely unknown.
Within-autism heterogeneity not addressed. Autism is a heterogeneous label; PGS analyses pool across that heterogeneity. If common-variant biology operates differently across subtypes (e.g., with vs. without intellectual disability), this study can’t see it.15
NODDI is a model, not a direct neurite count. ICVF is a parameter from a biophysical model fitted to multi-shell diffusion MRI signal.5 Histological validation supports the interpretation as neurite density, but the metric and the underlying biology are not identical.
Sex differences were largely null. Despite a 4-fold male skew in autism diagnosis, no robust sex×PGS interaction emerged at the global or regional level after correction. The sex-stratified GWAS were modestly powered, so this is not a strong test — but as far as the current data go, sex-differential common-variant effects on the brain phenotypes measured here don’t appear to mediate the diagnostic skew.1
Participation bias. UK Biobank participants are healthier, wealthier, and more European-ancestry than the broader UK population; ABCD has its own selection patterns.16 Both could attenuate or distort PGS-phenotype associations.
What Researchers Ask About Polygenic Scores and Neurite Density
Does this mean people with high autism PGS have visibly different brains?
Not at the individual level. The variance explained by autism PGS in any single brain phenotype is on the order of 0.01% to 0.07%, which is far too small to predict an individual’s brain structure from their genetic score. The findings are statistical patterns visible only in samples of tens of thousands.1
Is reduced neurite density bad?
Not in any straightforward sense. Neurite density (ICVF) varies normally across people and changes across the lifespan. Reductions are associated with several conditions including schizophrenia, Parkinson’s disease, and seizure disorders, but the same direction also shows up in healthy general-population variation. It’s a marker of differences in brain microstructure, not a measure of brain damage.12
Could this be used as a diagnostic test for autism?
No. Autism PGS itself explains only 1% to 2% of variance in autism diagnosis; using PGS-derived neurite density as a clinical marker would be substantially worse than that. The signal is biologically informative, not diagnostically useful.3
Why didn’t Mendelian randomization find a causal effect?
The autism GWAS produces relatively few genome-wide significant SNPs to use as instruments, and MR needs strong instruments to detect causal effects, especially small ones. The null is consistent with the instruments being too weak to find a true effect, and the authors recommend revisiting MR as autism GWAS sample sizes grow.13
Is the finding specific to autism or shared with other conditions?
Shared, at least in part. Schizophrenia PGS shows similar negative associations with ICVF, and the autism-PGS and schizophrenia-PGS effects on ICVF correlate at r = 0.33. Reduced neurite density may be a transdiagnostic marker of neurodevelopmental and psychiatric vulnerability rather than an autism-specific feature.2
References
- Polygenic scores for autism are associated with reduced neurite density in adults and children from the general population. Gu Y, Maria-Stauffer E, Bedford SA, et al. Molecular Psychiatry. 2025;30:3393–3403. doi:10.1038/s41380-025-02927-z
- Grey and white matter microstructure is associated with polygenic risk for schizophrenia. Stauffer EM, Bethlehem RAI, Warrier V, et al. Molecular Psychiatry. 2021;26:7709–7718. doi:10.1038/s41380-021-01260-5
- Identification of common genetic risk variants for autism spectrum disorder. Grove J, Ripke S, Als TD, et al. Nature Genetics. 2019;51(3):431–444. doi:10.1038/s41588-019-0344-8
- Polygenic prediction via Bayesian regression and continuous shrinkage priors. Ge T, Chen CY, Ni Y, Feng YA, Smoller JW. Nature Communications. 2019;10:1776. doi:10.1038/s41467-019-09718-5
- NODDI: practical in vivo neurite orientation dispersion and density imaging of the human brain. Zhang H, Schneider T, Wheeler-Kingshott CA, Alexander DC. NeuroImage. 2012;61(4):1000–1016. doi:10.1016/j.neuroimage.2012.03.072
- Brain charts for the human lifespan. Bethlehem RAI, Seidlitz J, White SR, et al. Nature. 2022;604(7906):525–533. doi:10.1038/s41586-022-04554-y
- LD score regression distinguishes confounding from polygenicity in genome-wide association studies. Bulik-Sullivan BK, Loh PR, Finucane HK, et al. Nature Genetics. 2015;47(3):291–295. doi:10.1038/ng.3211
- Genome-wide meta-analysis of depression identifies 102 independent variants and highlights the importance of the prefrontal brain regions. Howard DM, Adams MJ, Clarke TK, et al. Nature Neuroscience. 2019;22(3):343–352. doi:10.1038/s41593-018-0326-7
- Neuroanatomy of autism. Amaral DG, Schumann CM, Nordahl CW. Trends in Neurosciences. 2008;31(3):137–145. doi:10.1016/j.tins.2007.12.005
- Neuroanatomical diversity of corpus callosum and brain volume in autism: meta-analysis, analysis of the Autism Brain Imaging Data Exchange Project, and simulation. Lefebvre A, Beggiato A, Bourgeron T, Toro R. Biological Psychiatry. 2015;78(2):126–134. doi:10.1016/j.biopsych.2015.02.010
- Minicolumnar pathology in autism. Casanova MF, Buxhoeveden DP, Switala AE, Roy E. Neurology. 2002;58(3):428–432. doi:10.1212/wnl.58.3.428
- Multivariate genome-wide association analysis of cortical microstructure in 36,663 individuals reveals shared genetics with brain-related traits. Warrier V, Stauffer EM, Liu Q, et al. Nature Genetics. 2023;55(8):1287–1296. doi:10.1038/s41588-023-01475-y
- Mendelian randomization: using genes as instruments for making causal inferences in epidemiology. Davey Smith G, Ebrahim S. Statistics in Medicine. 2008;27(8):1133–1163. doi:10.1002/sim.3034
- Clinical use of current polygenic risk scores may exacerbate health disparities. Martin AR, Kanai M, Kamatani Y, et al. Nature Genetics. 2019;51(4):584–591. doi:10.1038/s41588-019-0379-x
- Heterogeneity in autism spectrum disorder: a clinical perspective. Lord C, Brugha TS, Charman T, et al. Nature Reviews Disease Primers. 2020;6:5. doi:10.1038/s41572-019-0138-4
- Comparison of sociodemographic and health-related characteristics of UK Biobank participants with those of the general population. Fry A, Littlejohns TJ, Sudlow C, et al. American Journal of Epidemiology. 2017;186(9):1026–1034. doi:10.1093/aje/kwx246