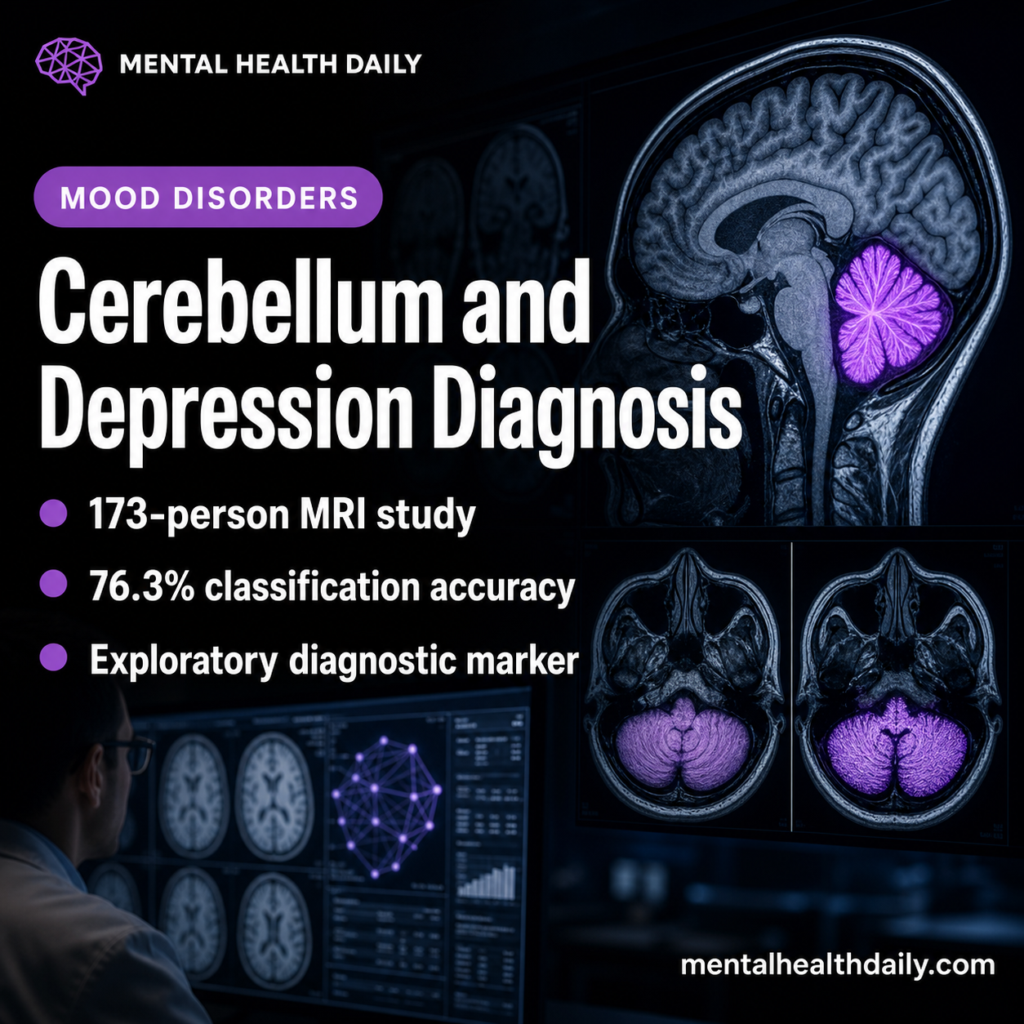
A 2026 structural MRI study found that cerebellar gray-matter patterns helped distinguish first-episode bipolar depression from unipolar depression: a model using significant cerebellar lobules reached 76.3% accuracy and AUC 0.779.1 The result is best read as proof-of-concept neuroimaging evidence, not as a scan-based bipolar diagnostic test.
Research Highlights
- Classifier performance was moderate: cerebellar lobules with significant group differences classified bipolar vs. unipolar depression with 76.3% accuracy, 83.0% sensitivity, 68.2% specificity, and AUC 0.779.1
- Sample size was 173: the final MRI analysis included 42 bipolar depression patients, 48 unipolar depression patients, and 83 healthy controls.1
- Total cerebellar volume differed: total cerebellar gray matter showed a group effect, F = 13.732, p < 0.001, with unipolar depression larger than bipolar depression.1
- Regional differences clustered posteriorly: bipolar depression showed smaller volume than unipolar depression in Vermis VIIIb, Vermis IX, Vermis X, Left Crus I, Left X, and Right X after FDR correction.1
- Clinical use is not ready: 68.2% specificity and no external validation mean this 2026 model cannot independently diagnose bipolar disorder.
Bipolar depression can look like unipolar major depression during a depressive episode, especially before clinicians have a clear history of mania or hypomania. That distinction changes treatment because antidepressant-only strategies can be risky or inadequate when the underlying illness is bipolar disorder.
The cerebellum supports motor coordination and also connects with cortical networks involved in attention, affect, default-mode processing, and cognitive control. Wang et al. used a cerebellum-focused MRI pipeline because broad whole-brain analyses can blur lobular patterns that matter for mood-disorder differentiation.
42 Bipolar and 48 Unipolar Depression Patients Entered the MRI Comparison
The study included 42 patients with bipolar disorder in a depressive phase, 48 patients with unipolar depression, and 83 healthy controls. For unipolar depression, first episode meant the first lifetime major depressive episode. For bipolar disorder, it meant the first depressive episode after a recognized manic, mixed, or hypomanic episode.1
Clinical severity: depression scores were similar between patient groups. HAMD-17 averaged 19.643 in bipolar depression and 18.708 in unipolar depression, p = 0.480. Anxiety scores differed more: HAMA averaged 25.667 in bipolar depression and 17.000 in unipolar depression, p < 0.001.
That anxiety imbalance is important. The researchers reported that including HAMA scores as a covariate did not remove the bipolar-vs-unipolar cerebellar differences, but the design still remains observational. It cannot prove whether cerebellar structure caused the diagnostic difference.
Cerebellar Gray Matter Was Smaller in Bipolar Than Unipolar Depression
Whole-cerebellum analysis found that total cerebellar gray-matter volume differed across groups, F = 13.732, p < 0.001. After covariate adjustment, unipolar depression had larger overall cerebellar gray-matter volume than bipolar depression, while unipolar depression did not differ clearly from healthy controls.1
Voxel-level analysis found smaller gray matter in bipolar depression than unipolar depression in Vermis IX, Vermis VI, and Left VI clusters. Region-of-interest analysis sharpened the pattern: 6 regions survived false-discovery-rate correction in the direct bipolar-vs-unipolar comparison.
- Posterior vermis signal: Vermis VIIIb, Vermis IX, and Vermis X were smaller in bipolar depression.
- Lateral cerebellar signal: Left Crus I, Left X, and Right X also survived correction.
- Network signal: the limbic cerebellar network was larger in unipolar depression than bipolar depression after correction.
76.3% Accuracy Is Useful, but 68.2% Specificity Is Not Diagnostic
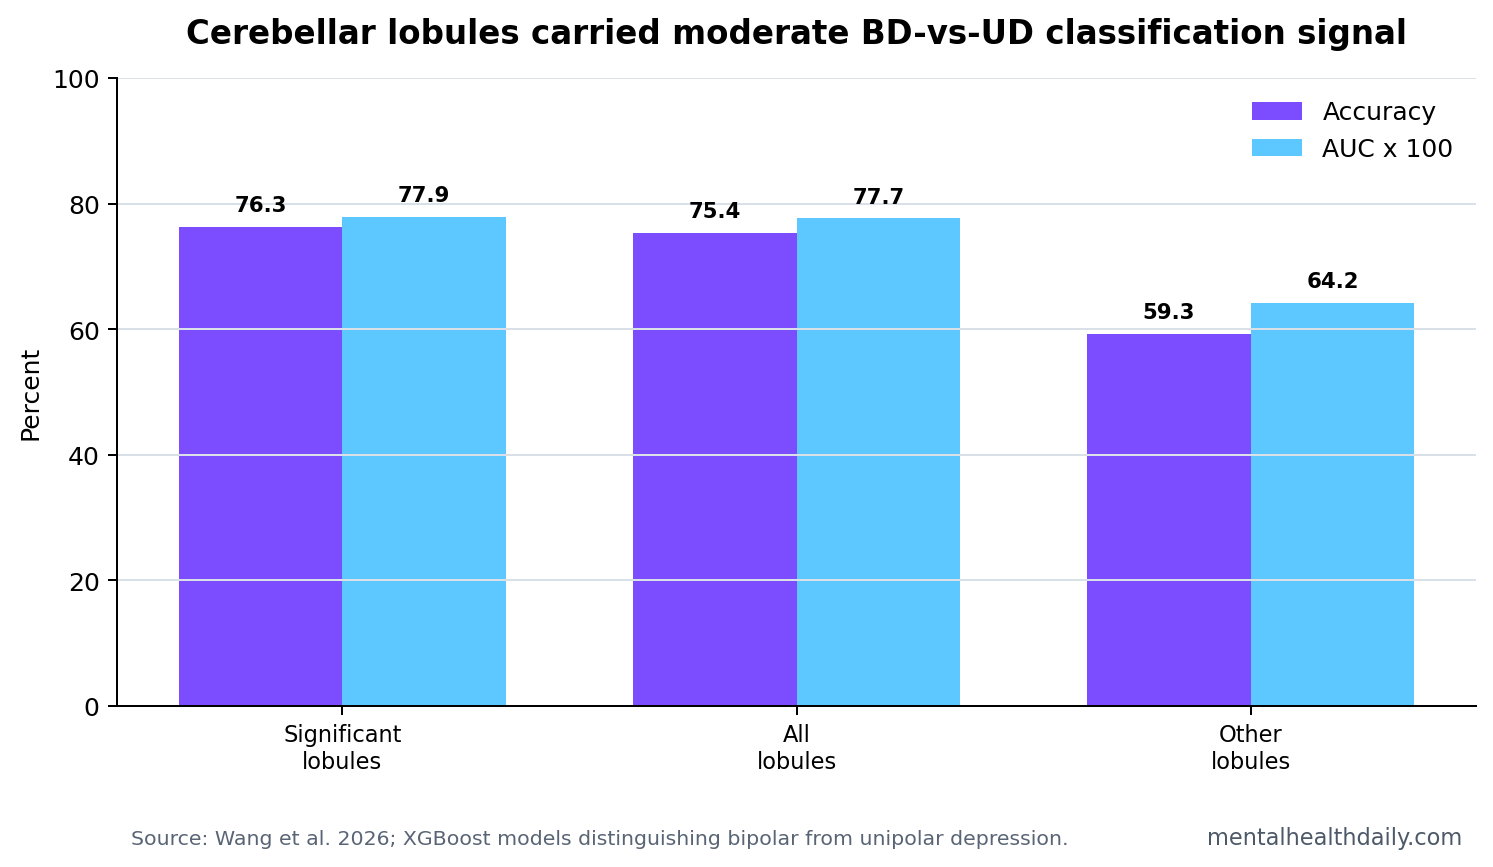
The machine-learning result is the headline, but it also shows the limitation. The best model used cerebellar lobules with significant group differences and achieved 76.3% accuracy, 83.0% sensitivity, 68.2% specificity, and AUC 0.779. A model using all lobules performed similarly, at 75.4% accuracy and AUC 0.777. A model using nonsignificant lobules performed worse, at 59.3% accuracy and AUC 0.642.1
Plain English: the cerebellar features carried real diagnostic information in this dataset, but the model would still misclassify too many people if used by itself. Specificity below 70% means a meaningful number of unipolar-depression patients could be incorrectly flagged as bipolar depression.
Cerebellar Mood-Disorder Biology Fits Prior Imaging, but Does Not Settle Causality
Prior psychiatric neuroimaging has repeatedly linked the cerebellum to schizophrenia, autism, bipolar disorder, major depression, and cognitive-affective networks.2 The 2026 study extends that literature by directly comparing bipolar and unipolar depression early in the depressive course, instead of comparing each diagnosis only with healthy controls.
Causal uncertainty: lower cerebellar gray matter in bipolar depression could reflect illness biology, developmental vulnerability, prior mood episodes, medication exposure, mood-state effects, or some mixture of those factors. Structural MRI alone cannot separate those explanations.
Adjacent bipolar-vs-unipolar classifier studies have the same basic problem. MRI patterns can distinguish groups above chance, but clinical deployment requires independent validation, calibration across scanners, stability across mood states, and evidence that the model improves decisions beyond careful history-taking.
The Practical Role Is Risk Stratification, Not Scan-Based Diagnosis
Evidence-strength note: this was a case-control MRI study with an exploratory classifier. It can support further research on cerebellar diagnostic markers. It cannot show that a young adult with depression should receive a bipolar diagnosis because a cerebellar model crosses a threshold.
The strongest clinical use case would be a second-layer risk tool. A patient with depressive symptoms, subtle bipolar-spectrum history, family history, antidepressant activation, or atypical course might eventually receive a scan-informed risk estimate. That is a different standard from replacing psychiatric diagnosis with MRI.
For now, the paper adds a concrete anatomical candidate to a difficult differential diagnosis: posterior and limbic cerebellar gray-matter patterns may carry information about bipolar-vs-unipolar depression that symptom ratings alone miss.
Specificity Changes the Clinical Use Case
Accuracy can look better than the clinical tool really is when groups are balanced and the decision is simplified. In practice, a depression clinic does not usually contain equal numbers of bipolar and unipolar depressive episodes, and the cost of a false bipolar label is not symmetrical with the cost of a missed bipolar course.
A false bipolar classification can change medication choices, affect identity, and push clinicians toward mood stabilizers or antipsychotics that carry their own risks.
That is why the 68.2% specificity deserves as much attention as the 76.3% accuracy. Specificity is the share of non-bipolar cases the model correctly leaves alone. If specificity is modest, the model may be useful for research enrichment or second-look risk stratification, but it is not ready to decide diagnosis.
Better near-term role: cerebellar MRI features could become one ingredient in a broader risk model that also includes age at onset, family history, antidepressant activation, episode pattern, sleep-energy changes, mixed features, psychosis, and longitudinal course. The MRI signal would need to add information beyond those ordinary clinical variables.
Cerebellar Subregions Make More Sense Than Whole-Cerebellum Labels
Saying “the cerebellum” can hide the result. Motor lobules, posterior cognitive-affective lobules, vermal regions, Crus I, and lobule X do not all carry the same functional meaning. The 2026 study is more useful because it named regional and network patterns rather than treating cerebellar volume as one undifferentiated number.
Network interpretation: posterior and vermal findings are plausible in mood disorders because these areas connect with large-scale networks used for affective prediction, self-referential processing, attention, and autonomic regulation.
That network anatomy gives the finding a better biological frame than a generic “brain volume difference” headline.
- Vermis IX and VIIIb: midline posterior regions that may relate to affective and autonomic integration.
- Crus I: a lateral posterior region often linked to cognitive and default-mode network functions.
- Lobule X: a vestibular-associated region whose mood-disorder role is less obvious and needs replication.
The regional detail also limits overstatement. A structural difference in these lobules places cerebellar network anatomy among the measurable traces of the bipolar-vs-unipolar distinction in this cohort.
Bottom line: the 2026 study gives cerebellar MRI a credible place in bipolar-depression biomarker research, while keeping the clinical verdict modest: useful signal, insufficient stand-alone test.
That balance is the main value of the paper for clinicians and researchers.
A practical diagnostic study would also compare cerebellar features with information clinicians already have: age at first depression, family history of bipolar disorder, antidepressant activation, psychosis history, sleep and energy changes, mixed symptoms, and longitudinal mood switching. MRI becomes valuable only if it adds information beyond that baseline.
The model should also be tested against medication exposure, illness duration, anxiety severity, and scanner-site effects, because each could mimic or dilute a cerebellar signal.
Questions About Cerebellar MRI and Bipolar Depression
Can this MRI model diagnose bipolar disorder?
No. The model reached 76.3% accuracy in one dataset and lacked external validation. It is too early and not specific enough to diagnose bipolar disorder in clinical practice.
Why focus on the cerebellum in depression?
The cerebellum connects with brain networks involved in affect, attention, default-mode processing, and cognitive control. Mood disorders can involve those networks, so cerebellar structure may carry diagnostic signal beyond motor coordination.
What would make the finding stronger?
Replication in independent first-episode cohorts, scanner-harmonized datasets, longitudinal conversion studies, and tests against clinical prediction models would show whether cerebellar MRI adds real diagnostic value.
References
- Wang S, et al. Cerebellar gray matter volume difference in first-episode bipolar and unipolar depression. BMC Psychiatry. 2026. doi:10.1186/s12888-026-08071-4
- Moberget T, et al. Cerebellar volume and cerebellocerebral structural covariance in schizophrenia. Molecular Psychiatry. PubMed
- Phillips ML, Swartz HA. A critical appraisal of neuroimaging studies of bipolar disorder: toward a new conceptualization of underlying neural circuitry and a road map for future research. Biological Psychiatry. 2014. PubMed
- Wise T, et al. Common and distinct patterns of grey-matter volume alteration in major depression and bipolar disorder. Molecular Psychiatry. PubMed