
A 2026 medRxiv preprint found that REDDI, a resting-state magnetoencephalography machine-learning pipeline, separated mild cognitive impairment, multiple sclerosis, Parkinson’s disease, and amyotrophic lateral sclerosis with 0.81 ± 0.04 balanced accuracy across 5 folds.1 That is a meaningful jump over the prior 67.1% MEG benchmark, but it is still research-stage decision support rather than a clinical diagnostic test.
Research Highlights
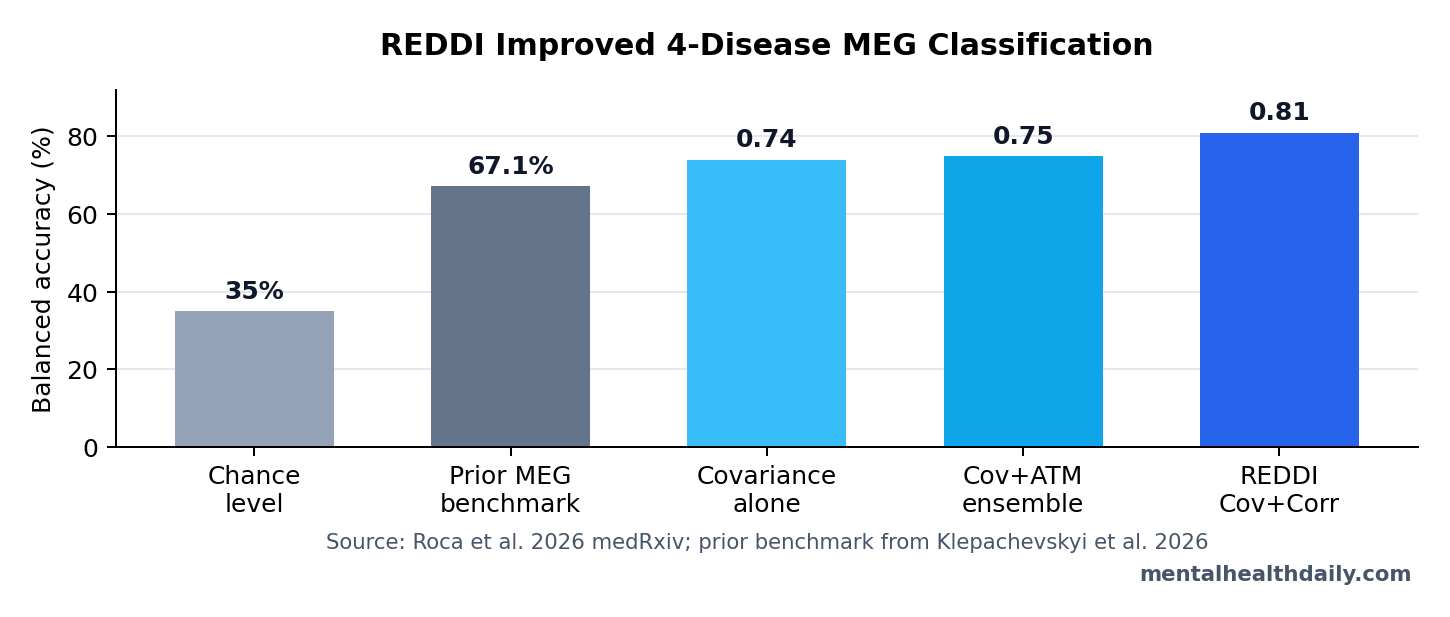
- REDDI reached 0.81 balanced accuracy: the Cov+Corr Riemannian ensemble classified 4 neurodegenerative disease groups with 0.81 ± 0.04 balanced accuracy in 5-fold cross-validation.1
- The prior MEG benchmark was lower: earlier multi-disease MEG work reported 67.1% balanced accuracy vs. 35% chance level, so the new pipeline adds a real internal-performance gain.2
- The sample was small but clinically varied: the dataset included 109 patients: 32 with mild cognitive impairment, 18 with multiple sclerosis, 20 with Parkinson’s disease, and 39 with amyotrophic lateral sclerosis.1
- Feature selection kept the model interpretable: Kruskal-Wallis and effect-size filtering reduced candidate features by 81% for avalanche-transition matrices and 97% for covariance/correlation matrices.1
- Clinical use is not established: this was a 2026 preprint without an external validation cohort, and Parkinson’s disease was the weakest class despite the strong overall average.1
Magnetoencephalography (MEG) records magnetic fields produced by brain electrical activity. It is faster than most structural imaging signals, so it can capture millisecond-scale communication across brain regions. In REDDI, those MEG signals were source-reconstructed into 116 anatomical regions, then translated into functional-connectivity matrices that describe how regions fluctuate together.
Balanced accuracy is the average of class-level accuracy values. It is more useful than ordinary accuracy when the groups are uneven, because a classifier cannot look good merely by favoring the largest group. Here, that mattered because the disease groups ranged from 18 multiple-sclerosis patients to 39 amyotrophic lateral sclerosis patients.1
REDDI Improved MEG Classification From 67.1% to 0.81 Balanced Accuracy
Roca et al. analyzed resting-state MEG recordings from 109 people with 4 neurological diagnoses: mild cognitive impairment (MCI; early cognitive decline that can precede dementia), multiple sclerosis (MS; immune-mediated damage to central-nervous-system myelin), Parkinson’s disease (PD; a movement disorder centered on dopaminergic neurodegeneration), and amyotrophic lateral sclerosis (ALS; degeneration of motor neurons).1
The practical problem was differential diagnosis: whether fast brain-network dynamics could separate disease categories from one another in a multi-disease comparison. A prior MEG benchmark by Klepachevskyi et al. used phase-based edge-centric connectivity metrics and reached 67.1% balanced accuracy vs. 35% chance level.2 REDDI raised the cross-validated mean to 0.81 ± 0.04.
Reader translation: REDDI did not discover a blood-test-style yes/no biomarker. It improved a research classifier trained on brain-network patterns. The result says MEG connectivity may contain enough disease-specific structure to support diagnostic triage research, especially when model design preserves interpretable regional features.
Covariance Plus Correlation Beat Single Connectivity Measures
The pipeline compared 3 functional-connectivity estimators: correlation, covariance, and avalanche transition matrices. Correlation measures how strongly 2 regional signals move together. Covariance captures shared variation while retaining scale information. Avalanche transition matrices describe how brief bursts of brain activity move between regions over time.
Covariance alone performed best among single estimators, with balanced accuracy of 0.74 ± 0.08. Correlation alone reached 0.64 ± 0.06, while avalanche transition matrices reached 0.51 ± 0.04. Covariance performed better than correlation (p = 0.047) and avalanche-transition matrices (p = 0.004).1
The ensemble step added the key gain. Combining covariance and correlation reached 0.81 ± 0.04, compared with 0.75 ± 0.07 for covariance plus avalanche-transition matrices. The Cov+Corr configuration was also significantly better than the standalone ATM and correlation estimators, with reported p < 0.005 comparisons.1
Riemannian Geometry Made Matrix Data Easier to Classify
Riemannian geometry is the mathematical framework REDDI used to work with covariance-style matrices as curved objects rather than flattening them into ordinary feature lists. In brain-signal classification, this matters because covariance matrices have structure: they are symmetric and, after regularization, positive definite. Treating them as ordinary vectors can throw away useful geometry.
Riemannian classifiers have a longer history in electroencephalography and brain-computer interfaces. Yger et al. reviewed why covariance-matrix methods can be robust and low-calibration in brain-signal tasks.3 Corsi et al. also showed that combining functional-connectivity estimators can improve brain-computer-interface performance, which matches REDDI’s logic of combining complementary matrices rather than trusting one representation.4
What REDDI added: the 2026 preprint moved that matrix-geometry logic into a multi-disease neurodegeneration task. The researchers projected covariance and correlation matrices into tangent space, used a k-nearest-neighbors classifier with k = 5, and ensembled predictions from the 2 connectivity representations.1
That design choice also explains why the result is more interesting than another generic “AI detects disease” claim. REDDI did not ask a black-box neural network to absorb all available MEG features and output a label. It first compressed the connectivity matrices into disease-discriminating regions, then used a geometry-aware classifier whose inputs remained tied to recognizable brain-network structure.
The tradeoff is that interpretability is still partial. A selected insula or cingulate feature can tell researchers where discriminative signal concentrated, but it does not prove that the selected region caused the disease, drove symptoms, or should become a treatment target. Interpretability here means “auditable classifier features,” not mechanistic proof.
Insula, Cingulate, Sensorimotor, and Parietal Regions Carried Signal
The interpretability claim came from feature selection, not from a post hoc story pasted onto a black-box model. The researchers used Kruskal-Wallis statistics and effect-size filtering to select discriminative brain regions before classification. That reduced considered features by 81% for avalanche-transition matrices and 97% for covariance/correlation matrices.1
The most informative regions repeatedly included the right insula, mid-cingulate cortex, supplementary motor area, paracentral lobule, inferior parietal cortex, precuneus, postcentral cortex, and occipital regions. Those are not random labels. Many sit inside large-scale sensory, motor, salience, and integration networks that neurodegenerative diseases can disrupt.
Network interpretation: Stam’s network-neuroscience review argued that neurological disorders often disturb large-scale brain organization rather than only a single focal site.5 REDDI fits that frame: disease separation appeared to depend on distributed functional-connectivity patterns, while still highlighting regions a neurologist or neurophysiologist can inspect.
Preprint Accuracy Does Not Make REDDI a Diagnostic Test
This evidence is promising but narrow. A 0.81 internal balanced accuracy is not the same as validated clinical performance. The study did not test a blinded external cohort, did not compare REDDI against neurologists, did not enroll undiagnosed clinic patients, and did not show that adding MEG changed treatment decisions or outcomes.
What the design can support:
- Resting-state MEG contained enough signal to separate 4 already diagnosed disease groups better than the prior MEG benchmark.
- Covariance and correlation carried complementary diagnostic information in this dataset.
- Riemannian matrix methods reduced overfitting concerns compared with several alternative classifiers inside the benchmark.
What the design cannot support:
- It cannot diagnose a new patient by itself.
- It cannot prove that REDDI generalizes to other MEG systems, hospitals, countries, or disease stages.
- It cannot replace neurological examination, MRI, laboratory testing, cerebrospinal-fluid biomarkers, electromyography, or longitudinal follow-up.
The most honest clinical read is triage-adjacent: if externally validated, a tool like REDDI could help decide which diagnostic pathway deserves attention when clinical findings overlap. It is not ready to sit at the center of diagnosis.
External validation also needs the hard comparison: whether REDDI adds information beyond ordinary clinical data. A classifier that separates already diagnosed patients inside a research dataset may still fail in the clinic if age, disease duration, medication status, motion artifacts, or referral patterns carry hidden signal. A stronger test would lock the model first, then evaluate newly referred patients whose diagnosis is uncertain at the time of MEG recording.
Access constraint: MEG is not available in most neurology clinics, and acquisition plus source reconstruction require specialized hardware and expertise.
Deployment constraint: the REDDI benchmark used cleaned resting-state recordings from already diagnosed patients, then source-reconstructed the signals into 116 atlas regions before classification.1 That is a controlled research pipeline, not the same environment as a busy memory, movement-disorders, or motor-neuron clinic where motion, medication timing, comorbidity, scanner differences, and uncertain diagnoses can all change the signal the model sees.
The near-term role is probably biomarker research, difficult-case triage, and cross-disease mechanism mapping rather than broad screening.
Questions About REDDI and MEG Neurodegeneration Classification
Which diseases did REDDI try to separate?
The preprint tested mild cognitive impairment, multiple sclerosis, Parkinson’s disease, and amyotrophic lateral sclerosis. It did not test every dementia subtype, atypical parkinsonism syndrome, motor-neuron mimic, or inflammatory neurological condition.
Was Parkinson’s disease classified as well as the other groups?
No. The researchers reported strong performance across most classes, with Parkinson’s disease showing more misclassification and the weakest ROC performance. Multiple sclerosis had near-perfect ROC performance with an AUC of 1.0, but that was inside a small cross-validation benchmark.
What would make REDDI clinically convincing?
An external validation study would need new patients from separate sites, prespecified diagnostic categories, locked model parameters, and comparison against ordinary diagnostic workflows. A useful study would also measure whether the MEG classifier changed diagnostic timing, downstream testing, or patient management.
References
- Roca M, Messuti G, Klepachevskyi D, et al. REDDI: A Riemannian ensemble learning framework for interpretable differential diagnosis of neurodegenerative diseases. medRxiv. 2026. doi:10.64898/2026.04.10.26350617
- Klepachevskyi D, Angiolelli M, Aristimunha B, et al. Magnetoencephalography-based interpretable automated differential diagnosis in neurodegenerative diseases. Heliyon. 2026. doi:10.1016/j.heliyon.2026.e44559
- Yger F, Berar M, Lotte F. Riemannian approaches in brain-computer interfaces: A review. IEEE Transactions on Neural Systems and Rehabilitation Engineering. 2017;25(10):1753-1762. doi:10.1109/tnsre.2016.2627016
- Corsi MC, Chevallier S, Fallani FDV, Yger F. Functional connectivity ensemble method to enhance BCI performance (FUCONE). IEEE Transactions on Biomedical Engineering. 2022;69(9):2826-2838. doi:10.1109/tbme.2022.3154885
- Stam CJ. Modern network science of neurological disorders. Nature Reviews Neuroscience. 2014;15(10):683-695. doi:10.1038/nrn3801