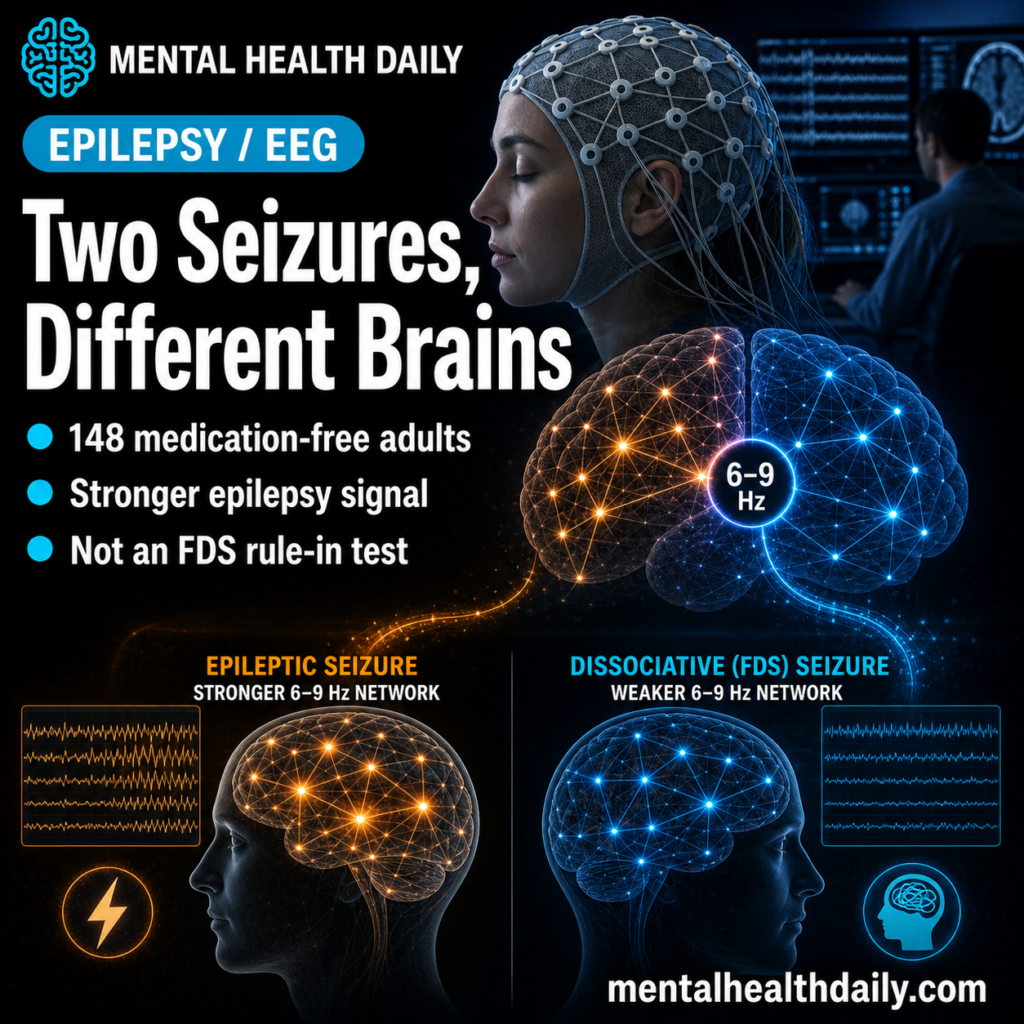
A 2026 diagnostic-accuracy preprint found that resting-state EEG network features separated non-lesional epilepsy from functional/dissociative seizures (FDS) at 67.5% balanced accuracy, but the signal was not symmetrical: sensitivity was 81.8% for epilepsy and only 53.3% for FDS.1 In plain clinical terms, the model looked more useful as an epilepsy-supporting marker than as a positive test for FDS.
Research Highlights
- Best resting-EEG model hit 67.5% balanced accuracy: Kissack et al. analyzed 148 medication-free adults with suspected seizure disorder, then focused the best model on 102 people with at least 4 usable EEG epochs.1
- Epilepsy sensitivity was much higher than FDS sensitivity: the SVM-RBF model identified epilepsy with 81.8% sensitivity, compared with 53.3% sensitivity for FDS, so a negative epilepsy-like network result cannot be read as a positive FDS result.1
- Temporal averaging improved the signal: requiring at least 4 EEG epochs and averaging features raised best performance from 62.6% to 67.5%, suggesting stable network estimates beat single-epoch noise.1
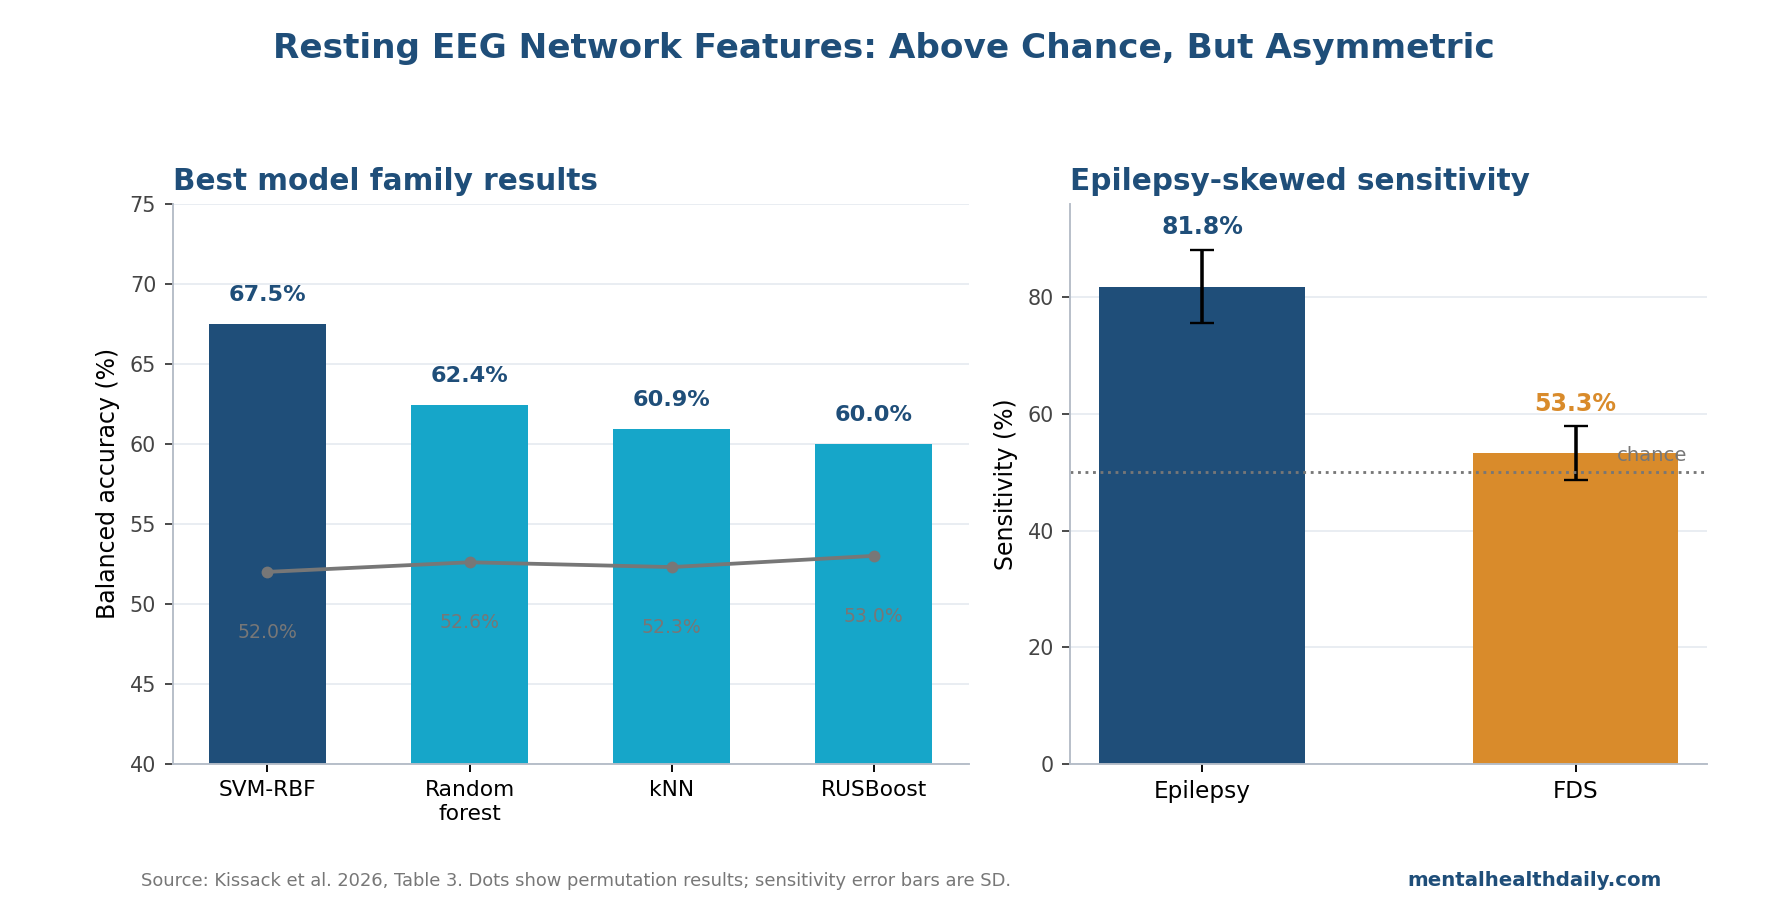
- Nonlinear models carried the best results: SVM-RBF, Random Forest, and k-nearest neighbors reached 67.5%, 62.4%, and 60.9% balanced accuracy, while linear SVM and logistic regression landed below 50%.1
- Routine EEG remains a low-yield comparator: a single routine EEG after a first unprovoked seizure has about 17% sensitivity in adults, which is why even modest decision-support gains can be clinically relevant.2
Functional/dissociative seizures are seizure-like episodes that are not driven by epileptiform brain activity. They can resemble epileptic seizures at the bedside, but the treatment path is different: epilepsy points toward antiseizure therapy and seizure-risk management, while FDS usually requires a functional neurological disorder workup, careful diagnosis communication, and psychological or rehabilitation-based treatment rather than escalating antiseizure drugs.3
The hard clinical scenario is not the textbook case with a captured event and obvious epileptiform discharge. It is the adult with suspected seizures, a visually normal interictal EEG, normal CT/MRI, and enough uncertainty that the next referral or treatment decision depends on probability rather than certainty.
Kissack et al. tested whether resting EEG contains network-level information in exactly that gray zone.1
148 Adults, Normal-Looking EEG, No CNS Medication at Recording
Kissack et al. reused a King’s College Hospital cohort previously studied with univariate EEG features.5 The full sample included 75 adults with non-lesional epilepsy and 73 adults with FDS, matched by age and sex.
Everyone had normal CT/MRI, was not taking central nervous system medication at the time of EEG, and had awake, eyes-closed, visually normal resting EEG segments selected for analysis.1
Those restrictions make the study cleaner than routine practice. They remove major confounders such as structural lesions, antiseizure medication effects, and obvious EEG abnormalities.
They also narrow the population: this is not evidence for children, lesional epilepsy, medicated patients, or acute emergency diagnosis.
Several baseline differences still survived matching. FDS patients had higher monthly seizure frequency, more left-handed or ambidextrous participants, and lower weekly alcohol use; video-EEG supported diagnosis in 80% of FDS cases and 59% of epilepsy cases in the full sample.
The researchers tested whether demographic and clinical variables alone could classify diagnosis, and those confounder models did not reach balanced accuracy above 59%.1
6–9 Hz Network Features Beat Single-Channel EEG Markers
Resting-state EEG records brain electrical activity while a person is not performing a task. The 2026 analysis filtered 21-channel clinical EEG into the 6–9 Hz band, a low-alpha range chosen because prior epilepsy network work had found discriminative signal there.1
The method did not ask whether one electrode looked abnormal. It built functional networks from pairwise relationships between electrodes.
Phase-locking factor (PLF) measured how consistently 2 EEG signals kept the same phase relationship over time, while lag captured the direction and size of that phase difference. From those relationships, the researchers computed network features such as network efficiency (how easily signal can move through the graph), mean functional connectivity (overall coupling strength), and trophic incoherence (how hierarchical or directionally organized the network is).1
Backward feature elimination most often selected 3 predictors: network efficiency, trophic incoherence, and mean functional connectivity. That result fits the underlying epilepsy model.
Seizures are network events, so interictal EEG may carry information in the edges and directionality between channels even when visual inspection sees no spike, sharp wave, or seizure.1
The contrast with the earlier Faiman et al. analysis is important. In the same general cohort, univariate resting-state EEG markers had limited clinical validity after confounding was controlled.5
Kissack et al. did not rescue routine visual EEG; they showed that multivariate network structure extracted from visually normal data contains more diagnostic information than a single-channel marker.
Best Model Reached 67.5% Accuracy, Mostly by Detecting Epilepsy
The best configuration used the 102 participants with at least 4 usable EEG epochs, no dimensionality reduction, and a support-vector machine with a radial-basis-function kernel. Balanced accuracy was 67.5%, with 81.8% sensitivity for epilepsy and 53.3% sensitivity for FDS.1
Balanced accuracy averages sensitivity across the 2 diagnostic classes, so it is useful when neither class should dominate the score. Here, the average hides the central clinical asymmetry.
The epilepsy side performed well above chance; the FDS side hovered close to chance.
The researchers stated the implication directly: the measures “should not be interpreted as markers of a positive diagnosis of FDS.”1 A positive epilepsy-like network output may support epilepsy as the diagnosis. A negative output does not prove FDS; it can also mean the resting recording did not capture the epilepsy-related network pattern.
Model choice also mattered. SVM-RBF, Random Forest, k-nearest neighbors, and RUSBoost reached balanced accuracies of 67.5%, 62.4%, 60.9%, and 60.0%.
Linear discriminant analysis, logistic regression, and linear SVM landed at 49.7%, 49.6%, and 47.8%. The useful signal was not a simple straight-line separation in feature space.1
Epoch Averaging Did More Than Dimensionality Reduction
One of the most useful technical findings was not a flashy algorithm. The full-sample 3-predictor models ranged from 51.7% to 62.6% balanced accuracy.
Restricting the analysis to participants with at least 4 usable epochs and averaging network features raised the best result to 67.5%, even though the sample shrank from 148 to 102 people.1
That pattern suggests resting EEG biomarkers need stable feature estimation before model complexity. Network metrics computed from a single short segment are noisy; averaging across available epochs may preserve trait-like signal while reducing transient state effects.
Dimensionality reduction did not clearly help. Principal component analysis and spectral embedding did not improve the 3-feature model in a consistent way, and PCA usually selected all 3 dimensions during inner cross-validation.
For this dataset, compressing the predictors removed little noise and did not create a better diagnostic representation.1
Comorbidity and Real-World EEG Will Stress the Marker
Subgroup results show why this is a model-development result, not a deployable diagnostic test. Balanced accuracy was 72.9% in participants without comorbidities and 59.3% in participants with comorbidities.
The drop was driven by FDS sensitivity falling from 63.1% without comorbidity to 40.0% with comorbidity.1
That is clinically important because real seizure clinics are full of mixed presentations: psychiatric comorbidity, antiseizure medication exposure, sleep deprivation, injuries, pain, substance use, and uncertain histories. The clean design protects the internal test of network features, but it probably overestimates how tidy the signal will look when deployed prospectively.
EEG background also changed performance. Participants with completely normal overall EEG investigations had 70.7% balanced accuracy, while those with nonspecific abnormalities elsewhere in the recording had 61.5%.
Epilepsy-specific abnormalities elsewhere in the recording produced 68.1%, but that subgroup included only 2 FDS participants, so the estimate is fragile.1
How Adjacent EEG Classifiers Frame the Result
The 2026 paper fits a larger move from visual EEG interpretation toward computational probability support. A 2021 systematic review by Faiman et al. found that resting-state EEG for epilepsy and psychogenic nonepileptic seizures was promising but held back by confounding, heterogeneous methods, and weak validation.4
The 2023 univariate analysis in the same cohort then showed why single-channel markers were not enough.5
More recent computational EEG studies point in the same broad direction but not with the same clinical target. Tait et al. used computational analysis of clinically noncontributory EEGs to estimate epilepsy likelihood in a retrospective multisite case-control study.6
Myers et al. tested dynamic network models for diagnosing epilepsy with normal interictal EEG.7
Those studies support the idea that normal-looking EEGs can contain hidden diagnostic signal, but Kissack et al. asked the sharper differential question: epilepsy vs. FDS before treatment initiation.
A hidden epilepsy signal leaves FDS diagnosis dependent on positive clinical evidence from semiology, captured events when available, and functional neurological disorder criteria.3
Limits of This Resting-EEG Classifier
Preprint status: the paper has not been peer reviewed, and the medRxiv notice explicitly says it should not guide clinical practice by itself.1
No external validation: all data came from one clinical setting and an existing cohort. The next test is a locked model on independent EEG systems, acquisition protocols, and referral populations.
Clean sample, narrower inference: participants were medication-free and had no structural lesion. Many real-world patients have antiseizure medication exposure, mixed comorbidity, or lesional epilepsy, and CNS drugs can alter resting EEG.
Average model potential, not one clinical product: the reported metrics come from nested cross-validation across model choices and split repeats. They show that the feature space carries information; they do not show that a finished clinical tool is calibrated, transportable, or outcome-improving.
Questions About Resting EEG for Epilepsy vs. FDS
Can this model diagnose FDS from a normal-looking EEG?
No. The best model’s FDS sensitivity was 53.3%, and the researchers explicitly warned that these network measures should not be read as positive markers of FDS.1
What would a positive epilepsy-like network result mean?
It would update probability toward epilepsy in the right clinical context. It should still be combined with seizure history, semiology, MRI, routine EEG interpretation, and video-EEG evidence when available.
Why is 67.5% balanced accuracy still worth studying?
A single routine EEG after a first unprovoked seizure has about 17% sensitivity in adults, so a modest computational marker could still improve referral decisions if it validates prospectively and adds information beyond standard assessment.2
What would make this clinically usable?
A locked model needs independent validation across centers, prospective testing in first-seizure and FDS referral pathways, performance estimates in medicated patients, and evidence that using the score improves diagnostic time, clinician confidence, or patient outcomes.
References
- Kissack P, Woldman W, Sparks R, et al. Multivariate resting-state EEG markers differentiate people with epilepsy and functional seizures. medRxiv. 2026. doi:10.64898/2026.04.14.26350505.
- Bouma H, Labos C, Gore G, Wolfson C, Keezer M. The diagnostic accuracy of routine electroencephalography after a first unprovoked seizure. European Journal of Neurology. 2016;23(3):455–463. doi:10.1111/ene.12739.
- LaFrance WC Jr, Baker GA, Duncan R, Goldstein LH, Reuber M. Minimum requirements for the diagnosis of psychogenic nonepileptic seizures: a staged approach. Epilepsia. 2013;54(11):2005–2018. doi:10.1111/epi.12356.
- Faiman I, Smith S, Hodsoll J, Young AH, Shotbolt P. Resting-state EEG for the diagnosis of idiopathic epilepsy and psychogenic nonepileptic seizures: a systematic review. Epilepsy & Behavior. 2021;121:108047. doi:10.1016/j.yebeh.2021.108047.
- Faiman I, Sparks R, Winston JS, et al. Limited clinical validity of univariate resting-state EEG markers for classifying seizure disorders. Brain Communications. 2023;5(6):fcad330. doi:10.1093/braincomms/fcad330.
- Tait L, Staniaszek LE, Galizia E, et al. Estimating the likelihood of epilepsy from clinically noncontributory electroencephalograms using computational analysis: a retrospective, multisite case-control study. Epilepsia. 2024;65(8):2459–2469. doi:10.1111/epi.18024.
- Myers P, Gunnarsdottir KM, Li A, et al. Diagnosing epilepsy with normal interictal EEG using dynamic network models. Annals of Neurology. 2025;97(5):907–918. doi:10.1002/ana.27168.