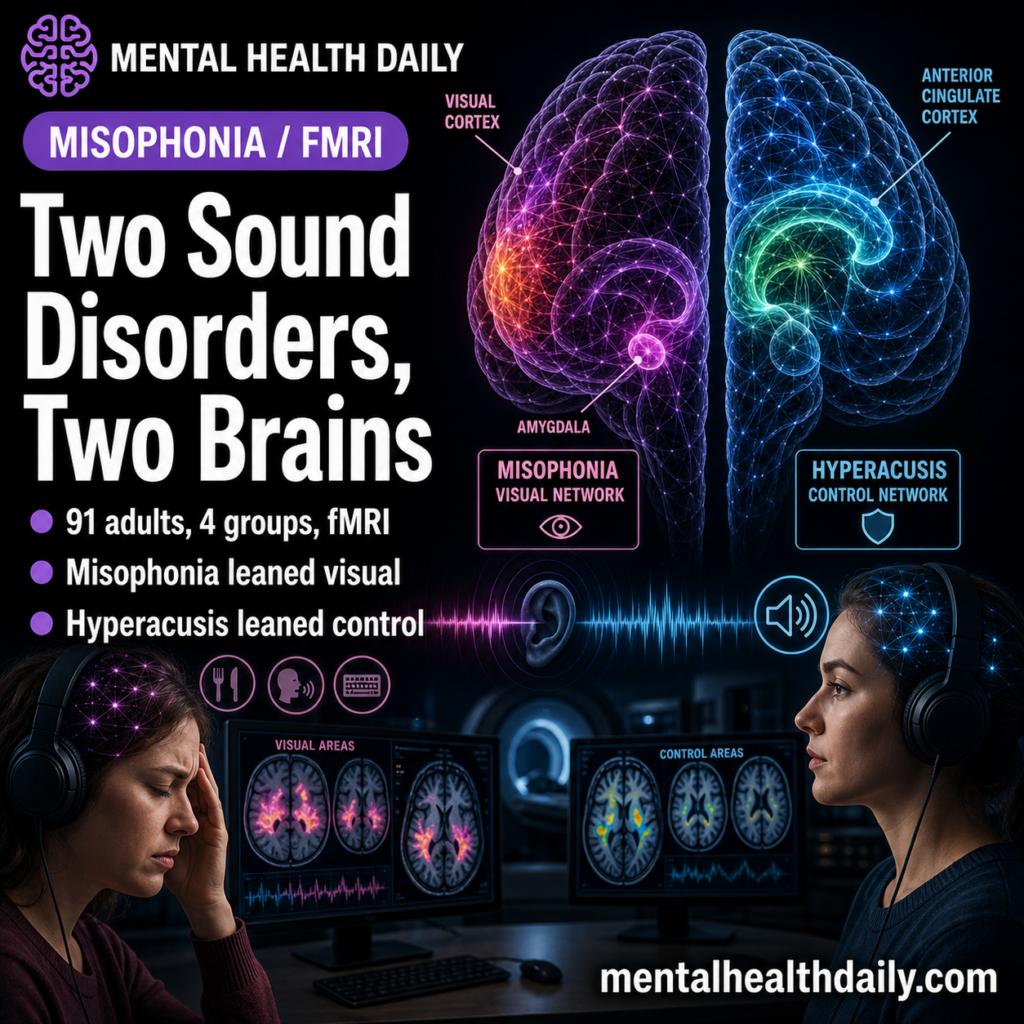
A 2026 task-based fMRI study of 91 young adults separated misophonia from hyperacusis inside the same “sound sensitivity” experiment: misophonia-containing groups showed visual association cortex and ACC-visual network changes during unpleasant sounds, while key hyperacusis contrasts showed weaker salience-control connectivity than misophonia.1 The scan data support separating trigger-specific sound aversion from loudness-driven sound intolerance, while diagnosis still belongs to careful interview and audiological workup.
Research Highlights
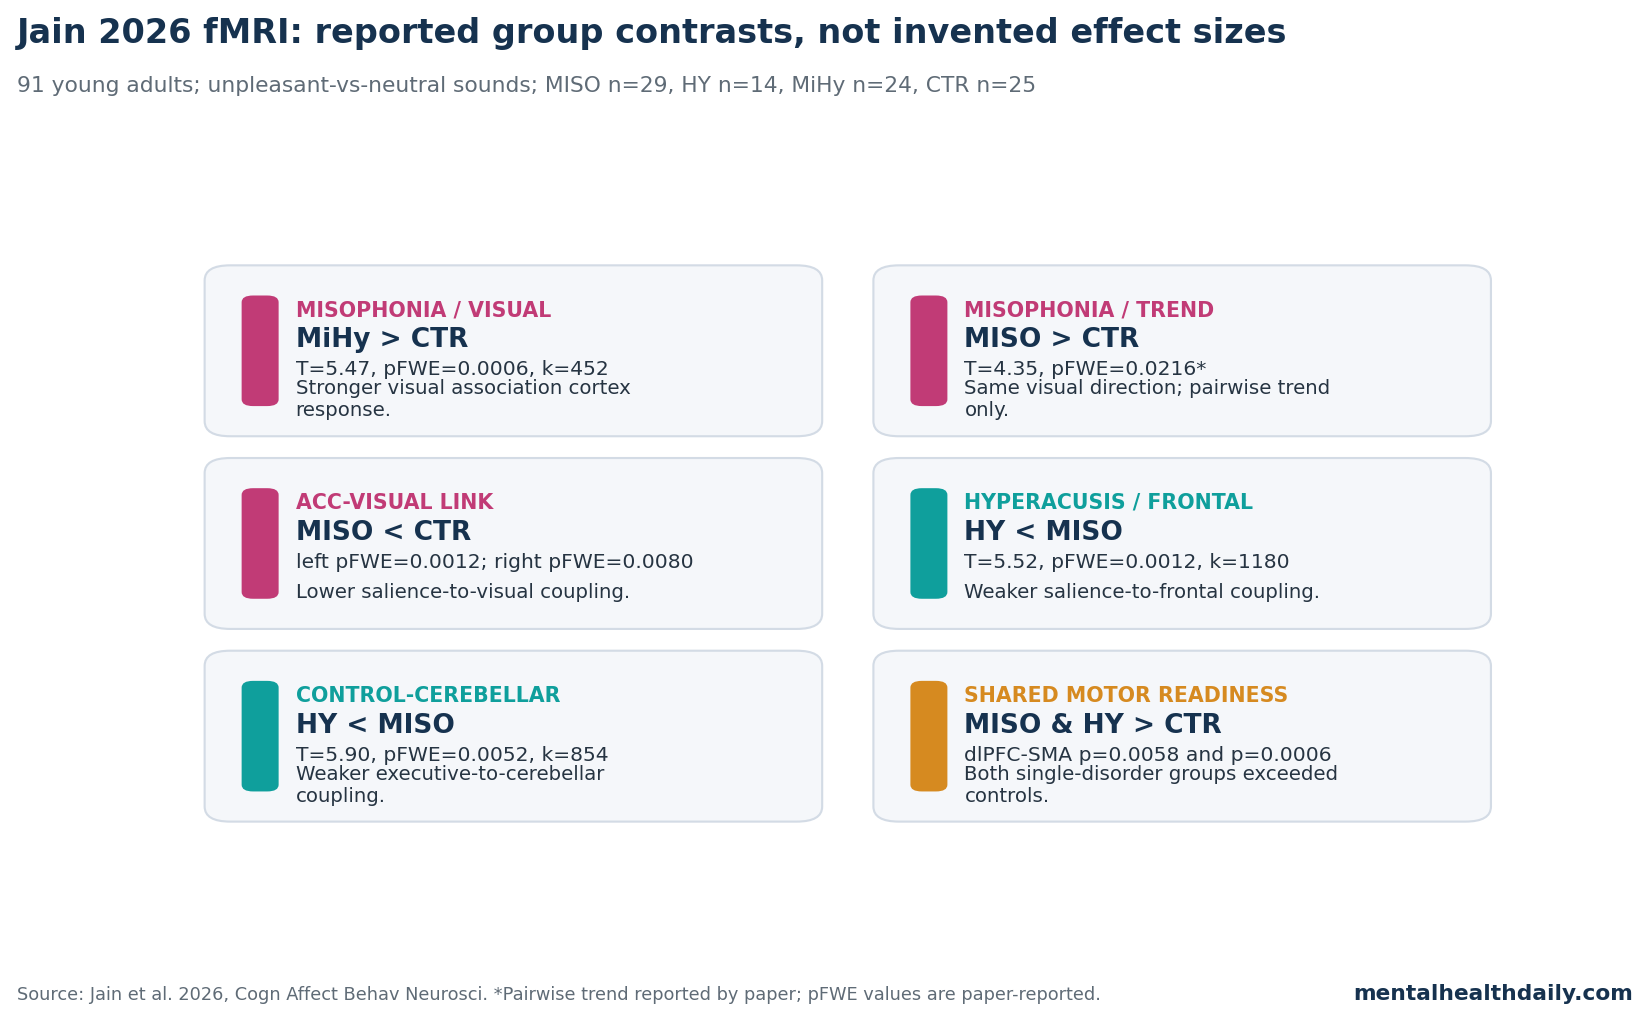
- 91-person fMRI comparison: Jain et al. analyzed 4 groups: misophonia only (n = 29), hyperacusis only (n = 14), comorbid misophonia plus hyperacusis (n = 24), and controls (n = 25).1
- Misophonia leaned visual and cross-modal: the whole-brain unpleasant-vs-neutral contrast found a visual association cortex group effect (F(3,87) = 11.39; pFWE = 0.0038; k = 962), with the comorbid group greater than controls at T = 5.47.1
- ACC-visual coupling was lower in misophonia: right ACC-to-left visual/angular connectivity was reduced in misophonia vs. controls (pFWE = 0.0080) and comorbid participants vs. controls (pFWE = 0.0064).1
- Hyperacusis leaned regulatory-network: left anterior insula-to-medial superior frontal connectivity was lower in hyperacusis than misophonia (T = 5.52; pFWE = 0.0012), while the hyperacusis-vs-control contrast was a non-Bonferroni-surviving trend (pFWE = 0.030).1
- Comorbidity was overlap, not a clean equation: the comorbid group carried visual/ACC features of misophonia and some frontal-control features of hyperacusis, but several contrasts were trends or absent, and the pure hyperacusis cell was small (n = 14).1
Misophonia means strong negative reaction to specific sounds, often chewing, breathing, sniffing, or repetitive human noises, where sound identity and context matter more than raw volume.2,3 Hyperacusis means reduced tolerance for sounds above a loudness threshold, where many different sounds can become uncomfortable or painful because they are too loud.2
A restaurant can be intolerable because one person is chewing, because the room is loud, because tinnitus and anxiety amplify the sound environment, or because more than 1 mechanism is stacked in the same person.
Brennan et al. found meaningful overlap between misophonia and hearing-related complaints in a college sample.4 The 2026 fMRI design answered the overlap problem directly by comparing misophonia-only, hyperacusis-only, comorbid, and control groups.
91 Young Adults Heard Standardized Sounds, Not Personal Triggers
Jain et al. recruited participants from a university screening pipeline and classified them with a structured misophonia interview, the Khalfa Hyperacusis Questionnaire, and audiological testing.1 The study initially recruited 92 people for fMRI, then excluded 1 participant for excessive motion, leaving 91 analyzed scans.
The design used 89 International Affective Digitized Sounds-2 stimuli arranged into 90 trials: 30 unpleasant, 30 pleasant, and 29 neutral sounds, with 1 pleasant sound repeated per list.1 Participants rated each sound during scanning, and the main group-level fMRI analysis focused on sounds each participant personally rated as unpleasant vs. neutral.
The important detail is what the task did not use. The researchers excluded commonly reported misophonic trigger sounds, especially orofacial noises.
That means the study tested general affective sound processing, not the full blast of a chewing, sniffing, or mouth-noise trigger.
Functional connectivity means correlated activity between brain regions during a task; it is not a direct wire, and it does not prove one region causes another region to fire. In this paper, lower connectivity means 2 regions were less tightly coupled during unpleasant-vs-neutral sound processing in one group than another.
Misophonia Showed Visual-Cortex Involvement During Unpleasant Sounds
The strongest whole-brain result was not primary auditory cortex. During unpleasant-vs-neutral sound processing, the 4-group analysis found a significant cluster in left visual association cortex extending into bilateral secondary visual areas (F(3,87) = 11.39; pFWE = 0.0038; k = 962; peak MNI −20, −90, 28).1
Group contrasts made the pattern more specific. The comorbid misophonia-plus-hyperacusis group showed greater visual association activation than controls (T = 5.47; pFWE = 0.0006; k = 452).
The misophonia-only group showed the same direction in left secondary/association visual cortex (T = 4.35; pFWE = 0.0216; k = 427), but the paper treated that pairwise result as a trend after correction.1
The result points to a cross-modal sound-processing signature. Even when personal trigger sounds were excluded, unpleasant sounds recruited higher-order visual processing differently in people with misophonia features.
Possible mechanism: cross-modal imagery may let an aversive sound recruit visual representations of the sound source.
That fits older misophonia work showing anterior insula and salience-network involvement during trigger sounds, plus motor and sensory-motor findings that pushed the field beyond a purely auditory explanation.5,6,7
ACC-Visual Connectivity Was Lower in Misophonia-Containing Groups
The connectivity results sharpened the visual finding. The anterior cingulate cortex (ACC), a salience and control region involved in attention to important stimuli, showed lower coupling with left superior lateral occipital/angular regions in misophonia-containing groups.1
- Right ACC to left visual/angular region: lower in misophonia vs. controls (pFWE = 0.0080) and comorbid participants vs. controls (pFWE = 0.0064).
- Left ACC to left visual/angular region: lower in misophonia vs. controls (pFWE = 0.0012), with the comorbid-vs-control comparison reported as a trend (pFWE = 0.048).
- Severity link: pooled misophonia questionnaire scores correlated with visual activation (Spearman rho = 0.315; adjusted p = 0.004), but the paper warned that pooled correlations may partly reflect between-group differences.
That pattern is more useful than a vague claim that “the brain lit up.” Misophonia was associated with stronger visual-area engagement and weaker ACC-visual coordination during generally unpleasant sounds. The finding suggests altered integration between salience detection and visual processing, not a standalone visual-cortex disorder.
Hyperacusis Pointed Toward Weaker Salience-to-Control Connectivity
Hyperacusis showed a different network emphasis. The left anterior insula-to-medial superior frontal gyrus connection was lower in the hyperacusis-only group than in the misophonia-only group (T = 5.52; pFWE = 0.0012; k = 1180).
The hyperacusis-vs-control comparison moved in the same lower direction but did not survive the paper’s stricter pairwise correction (pFWE = 0.030).1
Central executive network findings added a second regulatory signal. Left dorsolateral prefrontal cortex-to-cerebellum Crus I connectivity was lower in hyperacusis than misophonia (T = 5.90; pFWE = 0.0052; k = 854), while the hyperacusis-vs-control comparison again remained a trend (pFWE = 0.017).1
Central gain is the model that the auditory system can turn up its internal gain when incoming sound input is altered or reduced, producing exaggerated responses to ordinary sound levels.8
Prior hyperacusis imaging has emphasized enlarged sound-evoked responses and auditory-limbic coupling, especially in tinnitus-heavy samples.9,10 Jain et al. added a control-network layer, suggesting that hyperacusis may also involve weaker coordination between salience detection and frontal/cerebellar regulation during aversive sound appraisal.
Comorbidity Carried Both Signatures, But Not Cleanly Additive Proof
The comorbid group is where a sloppy article would say “both disorders add together” and stop. Jain et al. were more careful.
MiHy participants showed the strongest visual activation contrast vs. controls, reduced ACC-visual coupling, and reduced ACC-frontal pole connectivity, so the group did carry features associated with both misophonia and hyperacusis.1
The pattern was not a perfect overlay. MiHy did not significantly differ from every group on every hyperacusis-weighted contrast, and the left anterior insula-to-frontal comparison was clearest for hyperacusis-only vs. misophonia-only.
A better read is that comorbidity combines selective trigger-related vulnerability with broader loudness/sound-tolerance vulnerability, while the exact network profile still needs larger samples.
Behaviorally, MiHy participants also rated more sounds as unpleasant than misophonia-only participants (p = 0.0026) and controls (p = 0.0002). They were more likely to classify predefined pleasant and neutral sounds as unpleasant, which fits a broader negative sound-appraisal bias in the comorbid group.1
Older Imaging Evidence Makes the Split Plausible
The Jain results make more sense when placed beside older imaging work. Kumar et al. found that misophonic trigger sounds increased anterior insula activity and coupling with emotion and self-referential regions.5
Schroder et al. reported altered activity in auditory cortex and salience-network regions during symptom provocation.6 Kumar et al. later emphasized motor-system involvement, especially around orofacial action representations, rather than simple loudness intolerance.7
Hyperacusis research has usually asked a different question. Hofmeier et al. studied functional biomarkers separating tinnitus patients with and without hyperacusis, and Koops et al. linked hyperacusis in tinnitus to enlarged cortical and subcortical sound responses except at the tinnitus frequency.9,10
Those studies fit a loudness and gain-control account better than a trigger-identity account.
The 2026 study’s contribution is direct comparison. It put misophonia, hyperacusis, their comorbid presentation, and controls into one affective-sound task.
That does not erase design differences across the older literature, but it reduces the risk of comparing misophonia findings from trigger-sound tasks with hyperacusis findings from pure-tone or tinnitus paradigms as if they were the same experiment.
Limits: Small Hyperacusis Group, Young Sample, and General Sounds
The pure hyperacusis group had only 14 participants, below the researchers’ intended minimum of 20 per group.1 The paper used nonparametric permutation testing and correction, but small cells make subgroup-specific effects easier to miss and easier to overinterpret.
The sample was also young and university-based. Hyperacusis is often studied in older adults, tinnitus populations, or patients with measurable hearing problems.
In Jain et al., participants were 18 to 25 years old and generally had normal hearing, with only 2 misophonia-only participants falling slightly into mild hearing-loss range on pure-tone average.1
Finally, the task used general affective sounds. That is a strength for comparing groups under a standardized condition, but it also means the study cannot answer how each participant’s personal chewing, breathing, tapping, or other trigger sound would have changed the result.
The fMRI finding is about trait-like processing of unpleasant sounds, not full individualized trigger exposure.
What Changes Clinically?
The practical implication is assessment, not scan-based diagnosis. A person who says ordinary sound is intolerable should be asked whether the problem is sound identity, loudness, or both. The answer changes the working model.
- Trigger-specific misophonia: the clinical target is the meaning, context, imagery, emotional surge, and action tendency attached to particular sounds.
- Loudness-driven hyperacusis: the clinical target is sound tolerance, loudness discomfort, auditory gain, and broader threat appraisal around everyday noise.
- Comorbid presentation: the person may need both lines of assessment, because general loudness intolerance and specific trigger reactions can coexist.
Psychometric work has also warned that current sound-sensitivity questionnaires do not always separate these constructs cleanly.11 That limitation showed up inside the 2026 paper: the hyperacusis-only group had elevated misophonia questionnaire scores despite not meeting structured-interview criteria for misophonia.1 Interview-level diagnosis and audiological workup still matter.
Questions About the Jain fMRI Findings
Did the study use each person’s misophonia trigger sounds?
No. The fMRI task used standardized affective sounds from IADS-2 and excluded common orofacial trigger sounds.
That makes the 91-person comparison cleaner across groups, but it means the study tested general unpleasant-sound processing rather than individualized trigger exposure.1
Was hyperacusis confirmed only by questionnaire?
No. Hyperacusis group assignment used a Khalfa Hyperacusis Questionnaire score above 22, and audiological testing supported the classification: loudness discomfort levels were lower in hyperacusis-only participants vs. controls (adjusted p = 0.003) and in comorbid participants vs. controls (adjusted p = 0.039).1
Did fMRI prove misophonia and hyperacusis are completely separate disorders?
No. The results support partially distinct network signatures, not perfect separation.
Misophonia leaned visual/salience-visual; hyperacusis leaned salience-control; both single-disorder groups showed stronger left dlPFC-to-SMA connectivity vs. controls, suggesting some shared motor-readiness response to aversive sounds.1
Can the scan diagnose an individual patient?
No. The study reported group-level fMRI differences.
It did not validate a diagnostic classifier, and it did not show that a clinician can scan 1 patient and determine whether the patient has misophonia, hyperacusis, or both.
Which result most needs replication?
The visual association cortex and ACC-visual connectivity pattern is the most important misophonia finding to replicate, especially with larger samples, individualized trigger-sound blocks, and symptom measures that separate trigger-specific aversion from broad sound intolerance.
References
- Jain N, Ajmera S, Shahsavarani S, et al. Differential brain responses to affective sounds in misophonia and hyperacusis: a task-based fMRI approach. Cognitive, Affective, & Behavioral Neuroscience. 2026. doi:10.3758/s13415-026-01435-z.
- Henry JA, Theodoroff SM, Edmonds C, et al. Sound tolerance conditions (hyperacusis, misophonia, noise sensitivity, and phonophobia): definitions and clinical management. American Journal of Audiology. 2022;31(3):513–527. doi:10.1044/2022_aja-22-00035.
- Swedo SE, Baguley DM, Denys D, et al. Consensus definition of misophonia: a Delphi study. Frontiers in Neuroscience. 2022;16:841816. doi:10.3389/fnins.2022.841816.
- Brennan CR, Lindberg RR, Kim G, Castro AA, Khan RA, Berenbaum H, Husain FT. Misophonia and hearing comorbidities in a collegiate population. Ear and Hearing. 2024;45(2):390–399. doi:10.1097/AUD.0000000000001435.
- Kumar S, Tansley-Hancock O, Sedley W, et al. The brain basis for misophonia. Current Biology. 2017;27(4):527–533. doi:10.1016/j.cub.2016.12.048.
- Schröder A, van Wingen G, Vulink NC, et al. Misophonia is associated with altered brain activity in the auditory cortex and salience network. Scientific Reports. 2019;9:7542. doi:10.1038/s41598-019-44084-8.
- Kumar S, Dheerendra P, Erfanian M, et al. The motor basis for misophonia. Journal of Neuroscience. 2021;41(26):5762–5770. doi:10.1523/jneurosci.0261-21.2021.
- Auerbach BD, Rodrigues PV, Salvi RJ. Central gain control in tinnitus and hyperacusis. Frontiers in Neurology. 2014;5:206. doi:10.3389/fneur.2014.00206.
- Hofmeier B, Wertz J, Refat F, et al. Functional biomarkers that distinguish between tinnitus with and without hyperacusis. Clinical and Translational Medicine. 2021;11(5):e378. doi:10.1002/CTM2.378.
- Koops EA, van Dijk P. Hyperacusis in tinnitus patients relates to enlarged subcortical and cortical responses to sound except at the tinnitus frequency. Hearing Research. 2021;401:108158. doi:10.1016/J.HEARES.2020.108158.
- Kula FB, Cropley M, Aazh H. Hyperacusis and misophonia: a systematic review of psychometric measures. Journal of the American Academy of Audiology. 2022;33(7/8):417–428. doi:10.1055/a-1896-5032.