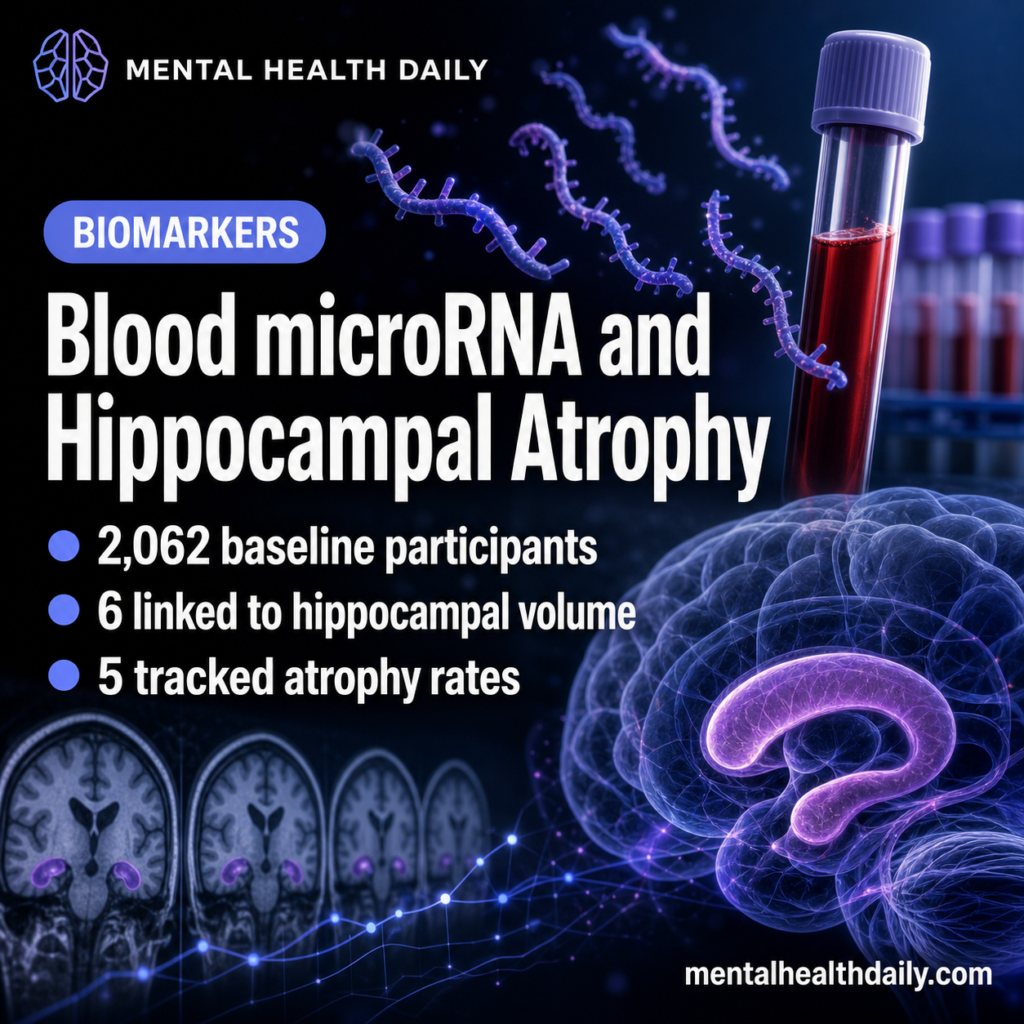
A 2026 Molecular Psychiatry analysis from the Rhineland Study found that blood-derived microRNA signatures were associated with hippocampal brain structure: 6 microRNAs linked cross-sectionally to left hippocampal volume, and 5 different microRNAs linked longitudinally to hippocampal atrophy rates.1 The result is biomarker-discovery evidence for brain aging, not a ready dementia blood test.
Research Highlights
- Baseline sample was large: the analysis included 2,062 participants with complete baseline microRNA and hippocampal MRI data.1
- 6 microRNAs linked to left hippocampal volume: miR-199a-3p, miR-199b-3p, miR-155-5p, miR-146a-5p, miR-6859-5p, and miR-505-5p survived correction for left hippocampal volume.1
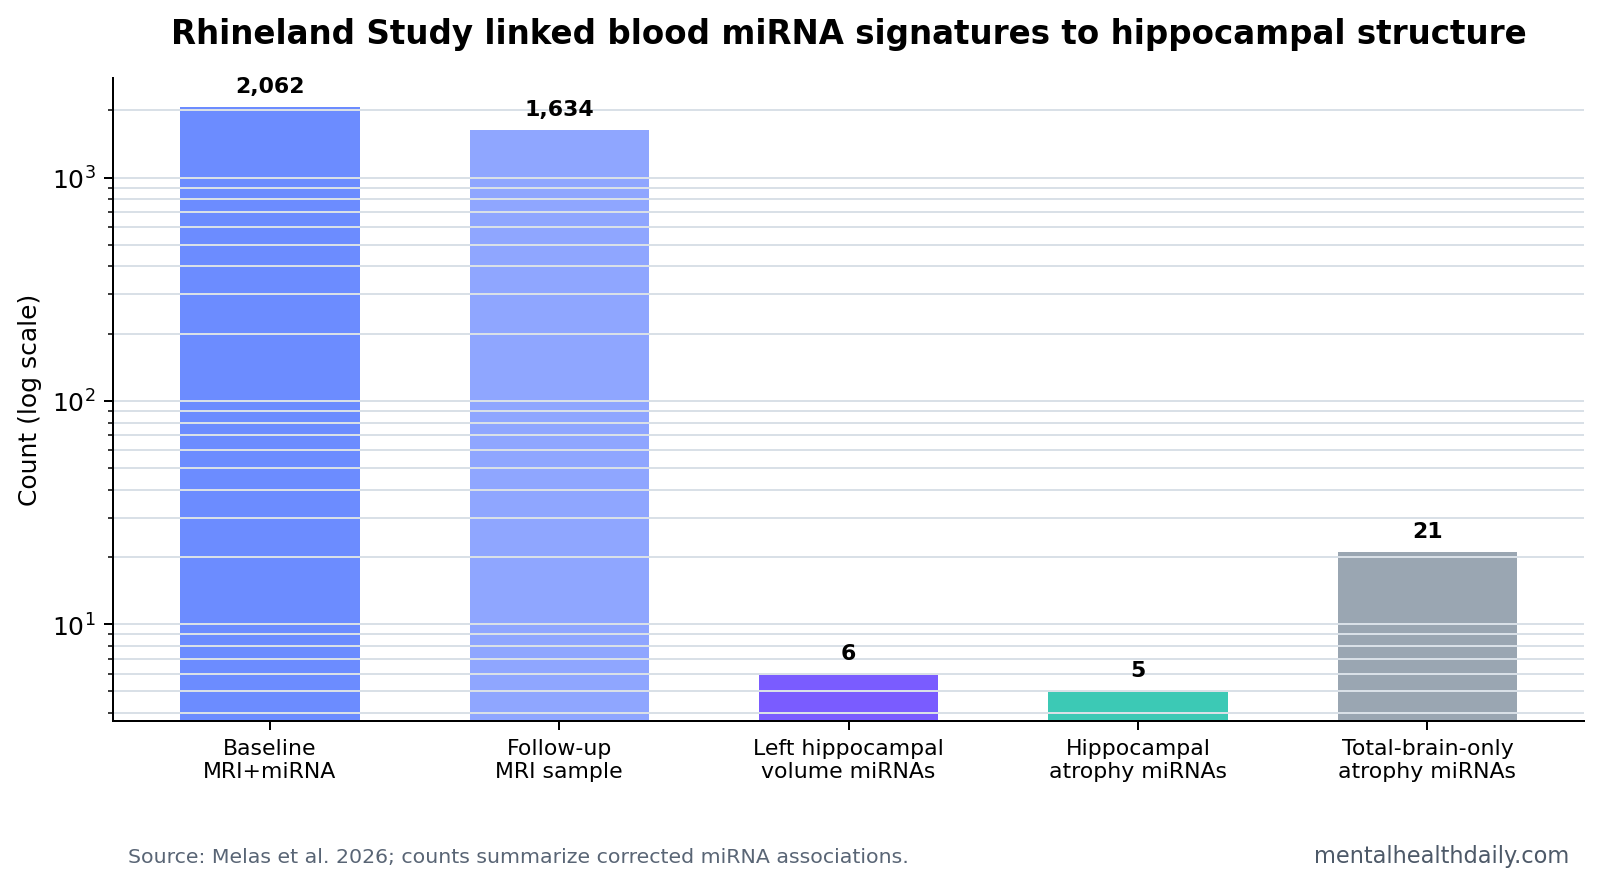
- 5 microRNAs tracked atrophy rates: miR-361-3p, miR-4473, miR-381-3p, miR-543, and miR-370-3p were associated with longitudinal hippocampal atrophy rates in 1,634 participants.1
- Joint variance was meaningful: the 5 longitudinal microRNAs explained 27.95% of left and 18.07% of right hippocampal atrophy-rate variance in the model.1
- Clinical validation is missing: the 2026 study did not test whether a microRNA panel detects MCI, Alzheimer’s disease, or dementia in individual patients.
MicroRNAs are short non-coding RNA molecules that help regulate gene expression after DNA has been transcribed. A single microRNA can influence many target genes, so blood microRNA patterns can act as broad biological signatures rather than 1-to-1 disease markers.
The hippocampus is a medial temporal-lobe structure central to memory formation and spatial navigation. Hippocampal shrinkage is not specific to Alzheimer’s disease, but faster hippocampal atrophy is one of the most important imaging patterns in cognitive aging and dementia risk.
2,062 Participants Had Baseline Blood microRNA and Hippocampal MRI Data
Melas et al. used population-based Rhineland Study data rather than a memory-clinic dementia sample. At baseline, 2,062 participants had complete microRNA and hippocampal imaging data. For longitudinal analyses, 1,634 participants had baseline microRNA data plus baseline and follow-up hippocampal MRI.1
The researchers measured 415 unique microRNAs and 11,019 unique genes in blood, then related microRNA expression to left hippocampal volume, right hippocampal volume, hippocampal asymmetry, and total brain volume. Hippocampal and total brain volumes were normalized for estimated total intracranial volume, which reduces confounding by head size.
Cognition anchor: larger hippocampal volume was associated with better global cognition. The standardized beta was 0.05 for the left hippocampus and 0.07 for the right hippocampus, with the right-side association p = 7.94 x 10−4.1
6 microRNAs Were Associated With Left Hippocampal Volume Only
Cross-sectionally, 6 microRNAs survived correction for left hippocampal volume: miR-199a-3p, miR-199b-3p, miR-155-5p, miR-146a-5p, miR-6859-5p, and miR-505-5p. Five were associated with larger left hippocampal volume, while miR-6859-5p was associated with smaller left hippocampal volume.1
The same microRNAs appeared near the top for right hippocampal volume, but right-side effects were weaker and did not survive multiple-testing correction. No microRNAs were significantly associated with hippocampal asymmetry, and the left-hippocampal hits formed a pattern distinct from total brain volume associations.
5 Baseline microRNAs Were Linked to Hippocampal Atrophy Rates
Longitudinally, 5 baseline microRNAs were associated with hippocampal atrophy rates: miR-361-3p, miR-4473, miR-381-3p, miR-543, and miR-370-3p. Increased baseline miR-361-3p and miR-4473 were associated with slower left hippocampal atrophy. Increased miR-381-3p, miR-370-3p, and miR-543 were associated with slower right hippocampal atrophy.1
The paper gave a concrete example for miR-361-3p. Average yearly left hippocampal volume change was −17.86 mm3, or −0.46% per year. One standard-deviation higher miR-361-3p expression shifted that rate to −15.98 mm3, or −0.41% per year, a relative 10.52% decrease in yearly atrophy.
Variance signal: when the 5 longitudinal microRNAs were modeled together, they explained 27.95% of left and 18.07% of right hippocampal atrophy-rate variance. That is a substantial modeling signal, but it is not the same thing as individual diagnostic performance.
Total Brain Atrophy Had a Broader microRNA Pattern
Total brain atrophy produced more hits than hippocampal atrophy. Baseline expression of 24 microRNAs was significantly associated with total brain atrophy rate over time, and 21 were exclusively associated with total brain atrophy in the paper’s summary.1
- Hippocampus-specific cross-sectional signal: 6 microRNAs linked to left hippocampal volume but not total brain volume.
- Shared longitudinal signal: 5 microRNAs linked to hippocampal atrophy were also nominally associated with total brain atrophy.
- Whole-brain aging signal: 21 microRNAs appeared tied to total brain atrophy without a hippocampus-specific pattern.
Blood microRNA Is Not the Same Kind of Biomarker as p-tau217
Protein-biomarker benchmark: modern dementia blood-biomarker discussion often centers on proteins such as plasma p-tau217, GFAP, and neurofilament light. Those markers are closer to disease-specific pathology or injury pathways, especially for Alzheimer’s biology.
microRNA interpretation: a blood microRNA signature is usually broader. It can reflect inflammation, vascular biology, immune-cell composition, cell stress, metabolism, and gene-regulation programs.
Evidence-strength note: this study can support biological discovery and risk-model development. It cannot show that a microRNA panel diagnoses MCI or dementia. The participants came from a general population cohort, and the main outcomes were MRI measures, not clinical conversion to Alzheimer’s disease.
Functional genomics made the signal more plausible. The longitudinal microRNAs targeted genes related to axonal and dendritic growth, and several identified microRNAs had prior links to Alzheimer’s disease. That supports biological relevance without solving clinical utility.
Why the Findings Are Stronger for Biology Than Screening
The Rhineland design is valuable because it connects blood molecular data with MRI change in a population cohort. That is a good setup for discovering biological pathways tied to brain aging. It is a weaker setup for proving screening performance because the study did not classify individual patients into dementia, MCI, or normal-cognition outcomes.
Screening standard: a screening test needs sensitivity, specificity, calibration, and a clinically meaningful threshold.
The 2026 paper reports corrected associations, explained variance, tissue expression, target-gene enrichment, and exploratory causal analyses. Those are the right tools for mechanism discovery, but they do not answer whether a clinician should order a microRNA panel.
Practical interpretation: blood microRNAs may eventually help identify biological subtypes of brain aging, especially when paired with MRI or established protein biomarkers. On their own, the current signals are closer to research leads than patient-facing results.
For screening, calibration matters as much as association strength. A marker can explain variance in a cohort and still misclassify too many individual patients for clinical use.
A useful panel would need to improve decisions beyond age, MRI volume, cognition, vascular risk, and established blood proteins, with error rates reported plainly.
Hippocampal Atrophy Is a Useful Outcome, but Not a Dementia Diagnosis
Hippocampal shrinkage is relevant because the hippocampus supports memory and is vulnerable in Alzheimer’s disease and other neurodegenerative processes. Still, hippocampal atrophy is not disease-specific. Normal aging, vascular disease, epilepsy, depression, sleep problems, stress biology, and mixed pathology can all influence hippocampal structure.
That makes the microRNA associations meaningful but broad. If a microRNA tracks atrophy rate, it may reflect inflammatory signaling, neuronal maintenance, vascular biology, immune-cell composition, or downstream response to brain aging. It does not automatically identify Alzheimer’s plaques, tau tangles, Lewy bodies, or vascular lesions.
- Best current use: mechanism discovery and risk-model research.
- Weak current use: stand-alone dementia screening.
- Most informative future comparison: microRNA panels tested alongside p-tau217, GFAP, neurofilament light, MRI atrophy, and cognitive change.
The left-vs-right pattern also deserves restraint. Cross-sectional hits were left-hippocampal, while longitudinal hits were more bilateral and also related to total brain atrophy. That split argues against a simple left-hippocampus-only story.
microRNA Results Need Replication Beside Established Blood Biomarkers
Clinical dementia biomarker development now has a high benchmark. Plasma p-tau217 can track Alzheimer’s tau biology more directly than a broad regulatory RNA signature, and neurofilament light can capture neuroaxonal injury across several disorders. A microRNA panel therefore has to prove added value rather than simply association with an MRI measure.
Added value could still exist. microRNAs may reflect upstream regulatory programs, immune activity, vascular change, or neuronal maintenance processes that protein biomarkers miss. They may also help identify why 2 people with similar hippocampal volume follow different atrophy trajectories. Those are valuable research questions, but they require prediction studies with cognitive outcomes.
Replication target: the useful next study would test the 6 cross-sectional and 5 longitudinal microRNAs in an independent cohort with MRI, plasma p-tau217, GFAP, neurofilament light, and longitudinal cognition. Without that comparison, the 2026 signal remains biologically interesting but clinically under-calibrated.
That comparison would also show whether microRNAs add pathway information after standard age, sex, education, vascular-risk, medication, inflammation, and baseline-volume adjustments.
Questions About Blood microRNA and Hippocampal Atrophy
Is this a dementia blood test?
No. The study linked blood microRNA expression to hippocampal MRI measures. It did not validate a diagnostic test for MCI, Alzheimer’s disease, or dementia.
Why does left hippocampal volume show more cross-sectional microRNA signal?
The paper found stronger corrected associations for the left hippocampus than the right. That may reflect lateralized hippocampal biology, statistical power, or measurement patterns, but the study does not prove a left-specific mechanism.
What would move this toward clinical use?
A clinically useful panel would need independent replication, prediction of cognitive decline or dementia conversion, comparison with p-tau217 and other blood proteins, and clear decision thresholds.
References
- Melas K, et al. Blood-derived microRNA signatures associated with hippocampal structure and atrophy rate: findings from the Rhineland Study. Molecular Psychiatry. 2026. doi:10.1038/s41380-026-03611-6
- Keller A, et al. Multiple sclerosis and dementia-related circulating microRNA biomarker studies. PubMed
- Jack CR Jr, et al. NIA-AA research framework: toward a biological definition of Alzheimer’s disease. Alzheimer’s & Dementia. 2018. PubMed
- Palmqvist S, et al. Plasma p-tau217 and other blood biomarkers for Alzheimer’s disease. PubMed