
A 2026 PRONIA preprint involving 727 discovery-sample participants found that early mental illness severity cut across psychosis risk, recent psychosis, and recent depression: groups with higher symptom severity also had poorer functioning, higher schizophrenia and depression polygenic risk, and lower gray matter volume.
Research Highlights
- Severity crossed diagnostic labels: Ye et al. stratified 727 participants into no, mild, moderate, and severe symptom groups, even though the original PRONIA groups were clinical high risk for psychosis, recent-onset psychosis, recent-onset depression, and healthy controls.
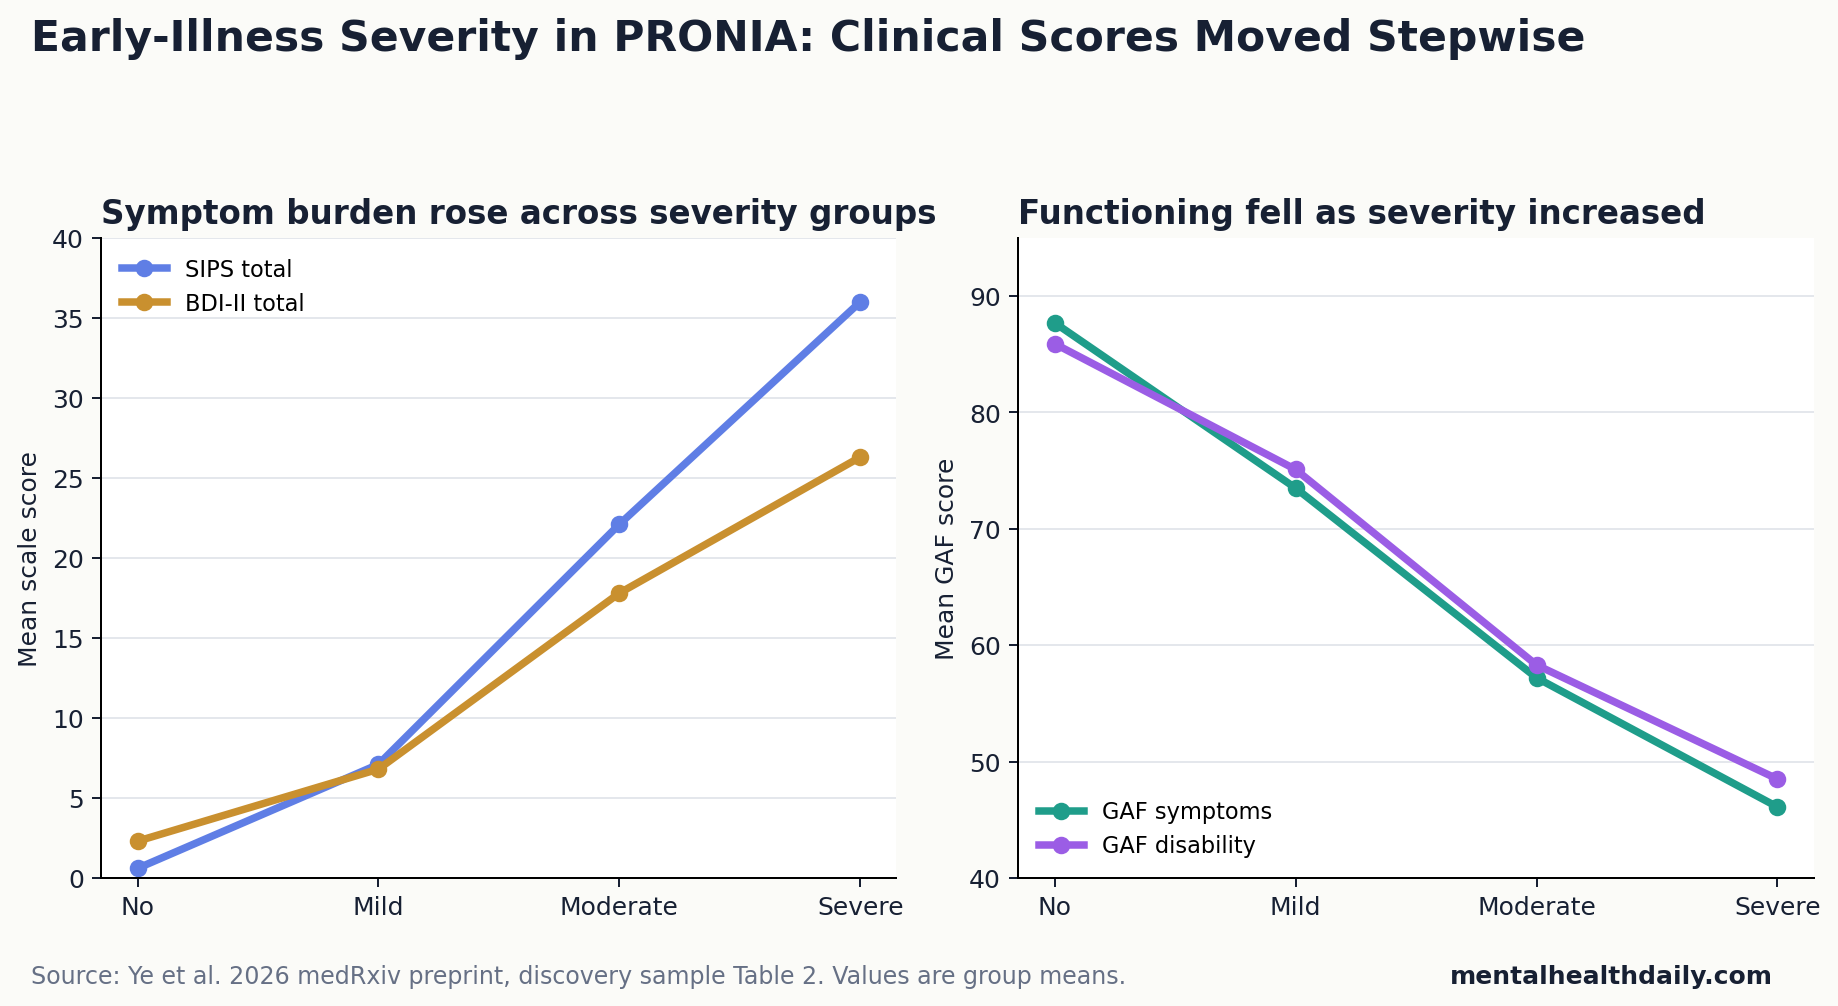
- Functioning declined stepwise: Mean GAF symptom scores fell from 87.7 in the no-symptom group to 46.1 in the severe group, with a large group effect (F(3,722) = 578.48, P < .001, eta2 = 0.71).
- Premorbid change appeared before baseline: Moderate and severe groups had worsening premorbid adjustment during youth alongside higher symptoms at study entry (F(3,2053) = 16.28, P < .001).
- Polygenic risk moved with severity: Schizophrenia polygenic risk rose linearly across severity groups (F(1,584) = 24.20, P < .001), and depression polygenic risk showed a significant linear association with a smaller effect than the schizophrenia PRS result (F(1,584) = 15.78, P < .001).
- Brain volume was a group-level signal: Lower gray matter volume tracked higher severity in temporal, cingulate, insula, and Rolandic-operculum regions, with discovery and replication maps correlating at voxel r = .21 and parcel r = .44.
Transdiagnostic severity means ranking illness burden by symptom load across diagnoses instead of treating schizophrenia risk, early psychosis, and depression as fully separate boxes. In this study, a person with severe depression symptoms could land in the severe group even if their original recruitment category was recent-onset depression, while a clinical-high-risk participant with less severe symptoms could land lower.
The severity ladder carried information beyond diagnosis only if it also aligned with premorbid functioning, 18-month course, polygenic risk, and structural MRI. Ye et al. tested those domains directly.
727 Participants Were Re-Sorted by Symptom Severity, Not Diagnosis
The discovery sample included 727 participants after filtering: 143 clinical-high-risk participants, 150 people with recent-onset psychosis, 151 with recent-onset depression, and 283 healthy controls. Mean age was 25.3 years, and 344 participants (47.3%) were male.
Researchers used the Structured Interview for Psychosis Risk Syndromes (SIPS) for positive and negative symptoms and the Beck Depression Inventory-II (BDI-II) for depression. The highest severity across positive, negative, cognitive basic, or depressive symptoms determined the final group.
- No symptoms: 241 participants.
- Mild symptoms: 50 participants.
- Moderate symptoms: 182 participants.
- Severe symptoms: 254 participants.
That regrouping changed the clinical picture. Recent-onset depression participants spread across mild, moderate, and severe groups. Clinical-high-risk participants mostly landed in moderate or severe groups. Recent-onset psychosis participants all landed in the severe group, but they were not the whole severe group.
Functioning Fell as Symptoms Rose Across the Severity Ladder
Baseline functioning showed the strongest clinical gradient. Global Assessment of Functioning (GAF) symptom scores averaged 87.7 in the no-symptom group, 73.5 in the mild group, 57.2 in the moderate group, and 46.1 in the severe group. GAF disability scores followed almost the same stair-step pattern: 85.9, 75.1, 58.3, and 48.5.
Symptom scales moved in the opposite direction. SIPS total scores rose from 0.6 to 7.1 to 22.1 to 36.0. BDI-II scores rose from 2.3 to 6.8 to 17.8 to 26.3. These are not subtle differences around a diagnostic threshold; they are large group separations across multiple clinical domains.
Premorbid adjustment means how well someone was functioning before the current illness period, including childhood and teenage social or academic adaptation. In Ye et al., no-symptom and mild-symptom participants showed stable, good premorbid adjustment, while moderate and severe groups worsened during youth (F(3,2053) = 16.28, P < .001, eta2 = 0.19).
Follow-up data also supported the severity gradient. Over 18 months, baseline severity was tied to trajectories for positive symptoms, negative symptoms, depression symptoms, functioning, and quality of life. The researchers reported that controlling for original diagnostic groups and symptom dimensions did not remove the core pattern.
Polygenic Risk Scores Were Higher in More Severe Groups
Polygenic risk scores estimate inherited liability by adding many common genetic variants, each with a tiny association with a disorder. They are group-level research tools; they are not diagnostic tests for individual patients.
Ye et al. analyzed genetic data from 588 discovery-sample participants after excluding people without genetic data and removing the small mild-symptom group. Schizophrenia polygenic risk increased linearly with severity (F(1,584) = 24.20, P < .001, eta2 = 0.04). Depression polygenic risk also increased linearly, with a smaller effect than the schizophrenia PRS association (F(1,584) = 15.78, P < .001, eta2 = 0.03).
Interpretation: the genetic signal was statistically clear but modest. An eta2 near 0.03–0.04 means polygenic risk explained only a small share of severity differences. The stronger claim is not that genes sorted individuals into clinical boxes; it is that inherited liability was not diagnosis-locked.
Cross-disorder polygenic risk behaved differently. The researchers found a quadratic association (F(1,584) = 8.27, P < .01), with the moderate symptom group showing the highest score. That result is interesting but less straightforward than the schizophrenia and depression PRS findings, and the replication analysis did not reach significance for cross-disorder PRS.
Gray Matter Volume Tracked Severity in Salience-Network Regions
Gray matter volume refers to structural MRI estimates of brain tissue containing neuronal cell bodies, dendrites, and synapses. In this study, lower group-average gray matter volume served as a shared neuroanatomical pattern across severity groups, not as a single-person diagnostic scan.
Imaging analysis included 653 discovery-sample participants after excluding unavailable or low-quality scans and removing the small mild group. Higher severity was linked to lower gray matter volume, especially in the bilateral temporal gyrus, middle and anterior cingulate, left insula, and right Rolandic operculum.
Those regions overlap with salience and attention systems that help the brain prioritize emotion, internal body signals, motivation, and socially relevant information. Goodkind et al. previously reported cross-disorder gray matter convergence in anterior insula and dorsal anterior cingulate regions, while larger ENIGMA and network-mapping work has argued that psychiatric diagnoses share some structural patterns but also retain disorder-specific differences.
Ye et al. add a severity-specific early-illness layer to that literature. The finding says that worse early symptom burden was accompanied by lower gray matter volume across a distributed network, even after analyses adjusted for recruitment group.
Replication Supported the Clinical and Brain Patterns
The replication sample included 565 participants after filtering. Clinical and functioning findings replicated at baseline and longitudinally. Premorbid functioning also showed a similar severity-linked pattern (F(3,1516) = 8.51, P < .001, eta2 = 0.21).
Group-level genetic analyses replicated for schizophrenia and depression polygenic risk. Cross-disorder PRS showed a similar shape but missed the significance threshold. Brain maps from discovery and replication samples were moderately correlated, with voxel-level r = .21 and parcel-level r = .44 (P < .05).
Evidence-strength note: this is a medRxiv preprint, not a peer-reviewed clinical tool. The cohort design can show that severity, functioning, genetics, and brain structure travel together. It cannot prove that one causes the other, and it cannot tell a clinician how to treat an individual patient from a polygenic score or MRI scan.
Diagnosis Still Matters, but Severity May Carry Cross-Diagnostic Biology
A calibrated read is that symptom severity did more than summarize distress. It also indexed premorbid decline, later clinical course, genetic liability, and gray matter differences across early psychosis-risk, psychosis, depression, and control participants.
Diagnosis still matters for medication choice, psychosis monitoring, mood-disorder care, safety planning, and service eligibility. The PRONIA result instead argues against pretending diagnosis is the only biologically meaningful axis. A severe depression presentation and a psychosis-risk presentation may share enough severity-linked liability that staging and treatment planning should measure both diagnosis and total illness burden.
Adjacent PRONIA evidence: related cohort work points in the same direction without making this preprint stand alone.
- Dwyer et al. found transdiagnostic clinical and brain clusters in early psychosis and affective stages.
- Korda et al. reported brain-texture markers of transdiagnostic clinical profiles in recent-onset psychosis and depression.
- Ye et al. add the severity layer: diagnosis, illness stage, symptom burden, and cross-diagnostic mechanisms may all need to be measured together.
Questions About Early Mental Illness Severity, Genetics, and Brain Volume
Does this mean diagnosis should be replaced by severity staging?
No. The study supports measuring severity across diagnoses, not deleting diagnoses. Psychosis, depression, and high-risk states still carry different clinical risks and treatment decisions.
Can a polygenic risk score identify who has severe early mental illness?
No. The schizophrenia and depression polygenic associations were statistically significant, but the effect sizes were small. Polygenic risk scores are useful for research on group patterns, not for diagnosing an individual person.
Can MRI brain volume diagnose early psychosis or depression?
No. The MRI result was a group-level gray matter pattern. It supports shared neurobiology across severity groups, but it is not a clinical imaging test.
What should clinicians or readers take from this preprint?
Early illness assessment should not stop at the diagnostic label. Symptom severity, functioning, premorbid change, and cross-diagnostic burden may help identify who is likely to remain impaired over time.
References
- Ye RR, Vetter C, Chopra S, et al. Common Substrates of Early Illness Severity: Clinical, Genetic, and Brain Evidence. medRxiv. 2026. https://doi.org/10.64898/2026.04.21.26350991
- Dwyer DB, Buciuman M-O, Ruef A, et al. Clinical, brain, and multilevel clustering in early psychosis and affective stages. JAMA Psychiatry. 2022;79(7):677-689. https://doi.org/10.1001/jamapsychiatry.2022.1163
- Goodkind M, Eickhoff SB, Oathes DJ, et al. Identification of a common neurobiological substrate for mental illness. JAMA Psychiatry. 2015;72(4):305-315. https://doi.org/10.1001/jamapsychiatry.2014.2206
- Korda AI, Andreou C, Ruef A, et al. Brain texture as a marker of transdiagnostic clinical profiles in patients with recent-onset psychosis and depression. Nature Mental Health. 2024;2(1):76-87. https://doi.org/10.1038/s44220-023-00168-z
- Segal A, Parkes L, Aquino K, et al. Regional, circuit and network heterogeneity of brain abnormalities in psychiatric disorders. Nature Neuroscience. 2023;26(9):1613-1629. https://doi.org/10.1038/s41593-023-01404-6
- Zimmerman M, Morgan TA, Stanton K. The severity of psychiatric disorders. World Psychiatry. 2018;17(3):258-275. https://doi.org/10.1002/wps.20569