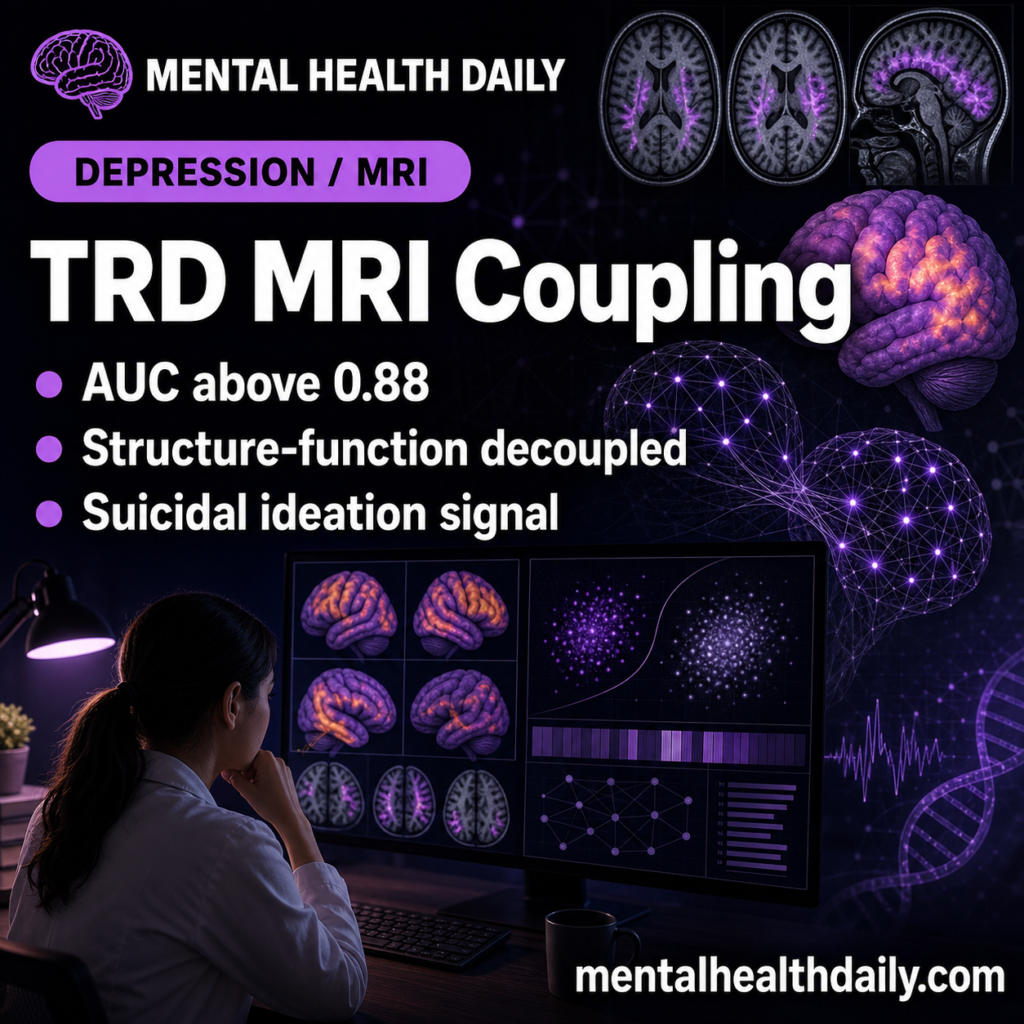
A 2026 multimodal MRI study found that treatment-resistant depression had lower coordination between brain structure and brain activity than non-treatment-resistant depression in frontal, parietal, motor, and temporal regions. Machine-learning models using those structure-function coupling measures classified treatment-resistant vs. non-treatment-resistant depression with AUC values from 0.886 to 0.950 in the primary atlas analysis.1
Research Highlights
- TRD sample was clinically distinct: Ye et al. compared 72 treatment-resistant depression patients, 154 non-treatment-resistant depression patients, and 84 healthy controls.1
- Illness burden was heavier in TRD: Mean depression duration was 51.06 months in TRD vs. 11.63 months in non-TRD, and age of onset was 22.25 vs. 27.16 years.1
- Four replicated regions stood out: TRD showed decoupling in the right middle frontal gyrus, left inferior parietal lobule, left precentral gyrus, and right superior temporal gyrus.1
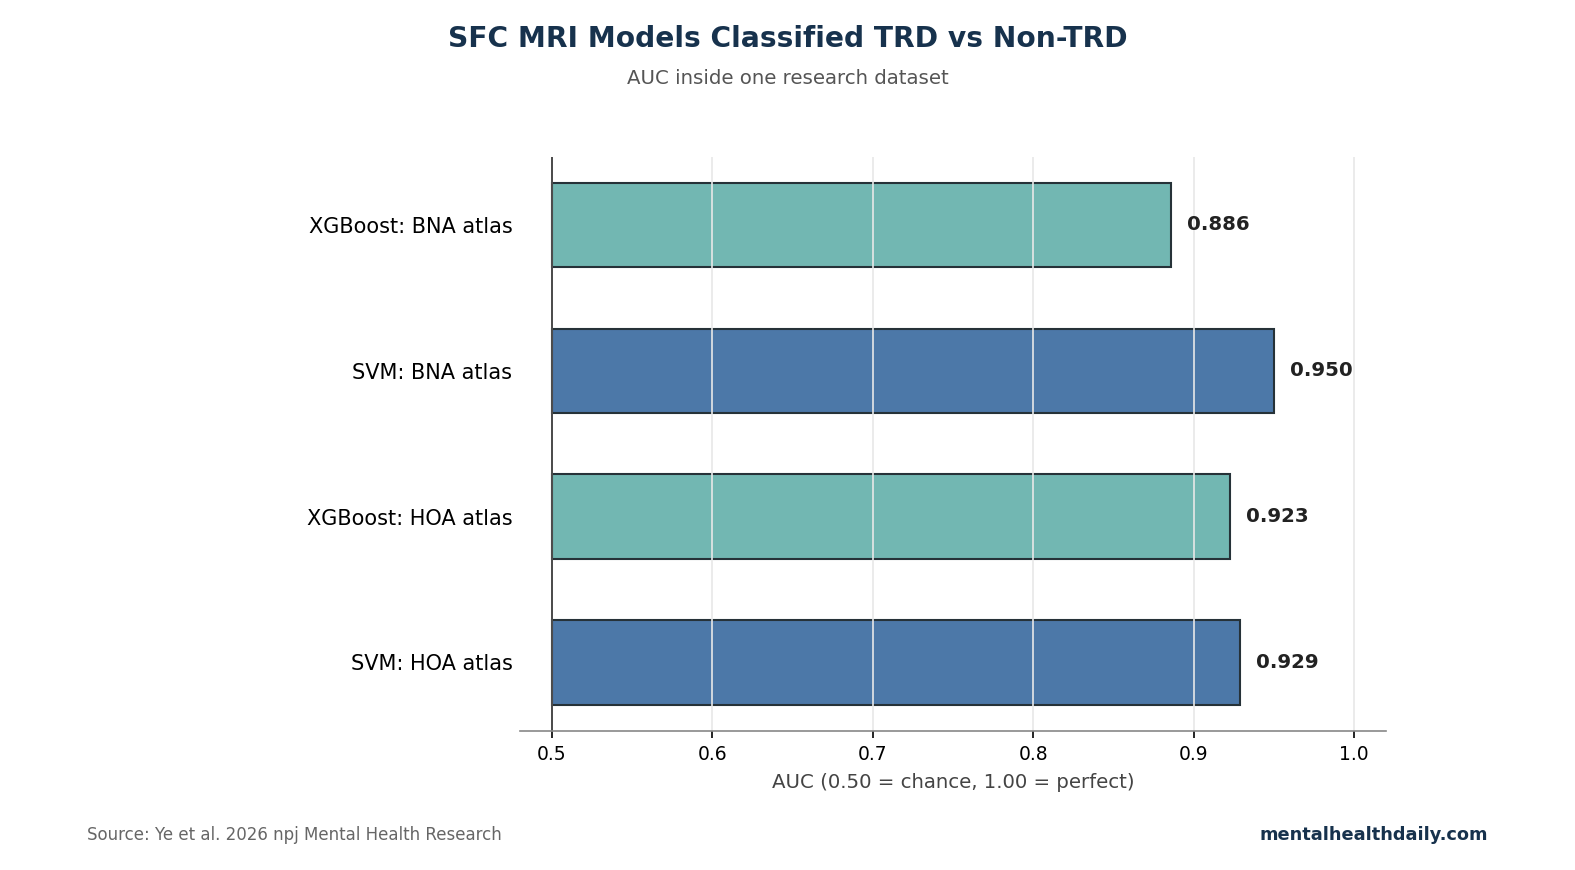
- Classification looked strong: XGBoost and support vector machine models reached AUC = 0.886 and AUC = 0.950 using BNA atlas results; HOA atlas models reached AUC = 0.923 and AUC = 0.929.1
- Clinical translation remains early: The design was cross-sectional, cognitive data were incomplete, sex distribution was imbalanced after quality control, and models need external validation.1
Structure-function coupling measures how closely regional brain anatomy aligns with regional brain activity. In this study, structural gray-matter volume and functional MRI activity were integrated to ask whether depression that resists treatment reflects a coordination problem rather than only too much or too little activity in one region.
72 TRD Patients Had Earlier Onset and Longer Illness Duration
The treatment-resistant group had mean age 26.33 years, mean depression duration 51.06 months, and mean onset at 22.25 years. The non-treatment-resistant group had mean age 28.19 years, mean depression duration 11.63 months, and mean onset at 27.16 years.1
- Depression severity: pretreatment HAMD-24 scores were similar, 31.28 in TRD and 30.96 in non-TRD.
- Anxiety burden: pretreatment HAMA scores were 22.81 in TRD and 21.25 in non-TRD.
- Post-treatment contrast: post-treatment HAMD-24 was 25.68 in TRD vs. 6.11 in non-TRD, reflecting the group definition.
- Suicidal ideation: pretreatment Beck Scale for Suicidal Ideation scores were 15.01 in TRD and 11.69 in non-TRD.
Those baseline differences matter. Imaging classification may reflect resistance biology, but it may also partly reflect earlier onset, longer duration, more cumulative treatment exposure, and the downstream consequences of prolonged illness.
TRD Decoupling Centered on Control and Somatic-Processing Networks
The strongest replicated structure-function differences involved the right middle frontal gyrus, left inferior parietal lobule, left precentral gyrus, and right superior temporal gyrus. These regions map onto frontoparietal control, attention, sensorimotor, and temporal processing systems.
Frontoparietal control network: this network supports goal-directed control, attention switching, and cognitive flexibility. Decoupling here fits clinical treatment resistance because patients often describe being unable to shift out of depressive cognition even when they know the content is distorted.
Sensorimotor and temporal regions: depression includes more than mood. Psychomotor slowing, bodily heaviness, disturbed sleep, and altered social perception are common. Coupling changes in motor and superior temporal regions fit that broader symptom body.
Hippocampal Coupling Tracked Suicidal Ideation in Non-TRD, Not TRD
In the non-treatment-resistant group, higher regional hippocampal structure-function coupling correlated with suicidal ideation (r = 0.329, p = 0.026) and feelings of despair (r = 0.305, p = 0.049). In the TRD group, those correlations were not significant.1
The researchers interpreted this as a stage-specific network pattern: in non-resistant depression, coupling may still track symptom-state variation, while in TRD the system may be more decoupled and less symptom-responsive. That interpretation is plausible but not proven by cross-sectional data.
AUC Above 0.88 Is Strong Inside One Dataset
AUC is area under the receiver-operating-characteristic curve, a measure of how well a model separates 2 groups across classification thresholds. AUC = 0.50 is chance; AUC = 1.00 is perfect separation.
Ye et al. reported AUC = 0.886 for XGBoost and AUC = 0.950 for support vector machine classification with the BNA atlas. With the HOA atlas, AUC values were 0.923 and 0.929.1
Evidence-strength note: this supports biomarker development, not clinical ordering of MRI scans for TRD classification. The models were trained and tested inside one research dataset, with conventional machine-learning methods and modest sample size. External validation would need separate hospitals, scanners, medication histories, and treatment definitions.
Why Coupling May Be More Informative Than Activity Alone
Many depression imaging studies ask whether a region is larger, smaller, more active, or less active. Structure-function coupling asks a different question: does the anatomy of a region align with the way it is functioning? A region can have ordinary gray-matter volume and ordinary average activity while still showing abnormal coordination between the 2.
Ye et al. reported that ALFF and gray-matter-volume differences alone did not reproduce the same spatial pattern seen in structure-function coupling.1 That detail suggests the TRD signal captured coordination between structure and function rather than a relabeled structural or functional abnormality.
- Structural-only marker: asks whether tissue amount differs.
- Functional-only marker: asks whether regional activity differs.
- Coupling marker: asks whether tissue architecture and activity are coordinated in the expected way.
- Clinical hypothesis: treatment resistance may reflect network integration failure rather than one abnormal region.
Biomarker Use Would Need a Decision Point
A biomarker becomes clinically useful only when it changes a decision. In TRD, possible decision points include whether to persist with another antidepressant trial, add psychotherapy, use lithium or atypical antipsychotic augmentation, move to ketamine or esketamine, refer for TMS, consider electroconvulsive therapy, or intensify suicide monitoring.
Decision standard: an MRI coupling test would need to outperform cheaper clinical data: number of failed treatments, episode duration, age of onset, comorbid anxiety, bipolar-spectrum features, trauma history, sleep disturbance, substance use, and baseline suicidal ideation.
- Minimum clinical test: imaging plus clinical variables vs. clinical variables alone.
- Minimum treatment test: predicted treatment path vs. usual trial-and-error sequencing.
Ye et al. showed a promising imaging classifier, not a comparison against a practical clinical-risk model.
The strongest next study would combine both. A model using clinical variables plus structure-function coupling should be tested against clinical variables alone, with external validation and a treatment decision built into the design.
TRD Imaging Should Be Tested Against Treatment Outcomes
The current study classified TRD status after treatment history had already defined the groups. A more clinically demanding design would scan patients before a new treatment and test whether coupling predicts response to a specific intervention. That could include TMS, ketamine, electroconvulsive therapy, psychotherapy augmentation, or medication switching.
Actionable biomarker: a scan would be useful if it identifies who should move faster to interventional treatment, who needs suicide-risk intensification, or who is likely to respond to a standard next-step medication. Classification alone is less valuable than a model tied to a treatment path.
Clinical Variables Still Carry Heavy Predictive Weight
Before MRI can improve TRD prediction, it has to beat ordinary clinical information. Earlier onset, longer episode duration, prior nonresponse, anxious distress, sleep disturbance, suicidality, trauma exposure, and medication intolerance already guide prognosis. Ye et al. reported several of these variables differed between groups, especially duration of depression and age of onset.1
- History-only benchmark: failed antidepressant count, episode duration, age of onset, baseline suicidal ideation, and anxiety severity should be modeled before MRI is added.
- Imaging-added benchmark: coupling should improve discrimination, calibration, or treatment selection beyond those variables and show information beyond illness chronicity.
- Prospective benchmark: scans should be collected before the next treatment decision, then tested against remission, relapse, or need for neuromodulation.
Medication exposure is another practical confounder. Long-running depression usually means more antidepressant trials, augmentation attempts, sleep medication, and neuromodulation consideration, so an imaging signature can mix illness biology with treatment-history effects unless the next study models both.
Best next model: imaging should add incremental value beyond those variables and demonstrate information that illness chronicity alone does not provide.
Patient-level caution: a group-level coupling abnormality cannot tell an individual patient that their depression is biologically fixed. TRD remains treatable, especially when medication history is rechecked and neuromodulation options are considered.
The scan result is best treated as a map of candidate mechanisms, not as a verdict on any patient’s future response.
Questions About MRI Coupling in Treatment-Resistant Depression
Can this MRI method diagnose TRD now?
No. It is a research biomarker. TRD remains a clinical pattern: inadequate response to at least 2 adequate antidepressant trials, with careful attention to dose, adherence, diagnosis, comorbidity, and bipolar-spectrum risk.
Why compare TRD with non-TRD instead of healthy controls only?
The useful clinical question is not whether depressed patients differ from healthy people. It is whether patients likely to resist standard treatment can be identified earlier than trial-and-error care allows.
Could this guide TMS targeting?
Possibly in the future. Regions with coupling abnormalities could help define individualized targets, but treatment trials would need to show that coupling-guided stimulation improves outcomes.
References
- Impaired regional structure-function coupling as novel neurophenotype: mechanistic insights and diagnostic exploration in treatment-resistant depression. Ye X, Ye S, Wei S, et al. npj Mental Health Research. 2026;5:27. doi:10.1038/s44184-026-00206-5
- Bupropion-SR, sertraline, or venlafaxine-XR after failure of SSRIs for depression. Rush AJ, Trivedi MH, Wisniewski SR, et al. New England Journal of Medicine. 2006;354:1231–1242. doi:10.1056/NEJMoa052963
- Resting-state connectivity biomarkers define neurophysiological subtypes of depression. Drysdale AT, Grosenick L, Downar J, et al. Nature Medicine. 2017;23:28–38. doi:10.1038/nm.4246
- Evaluating the evidence for biotypes of depression. Dinga R, Schmaal L, Penninx BWJH, et al. NeuroImage: Clinical. 2019;24:101976. doi:10.1016/j.nicl.2019.101976