Machine-learning models reading brain-wave recordings correctly sorted about 81% of children with and without ADHD in a 2026 study of 121 children ages about 7 to 12.1
The models were tested on one existing dataset, and each child was scored by a model that had never seen that child’s data.
Research Highlights
- About 4 in 5 children sorted correctly: the best model, a Random Forest, reached 81% accuracy (95% range 74% to 88%) in telling 61 children with ADHD from 60 children without it.1
- Errors went both ways: in a child-by-child test of a second model, 10 of 61 children with ADHD were missed and 13 of 60 children without ADHD were wrongly flagged.1
- 3 models tied: Random Forest, a support vector machine and Gradient Boosting did not differ significantly; only plain logistic regression lagged (71%).1
- Frontal electrodes mattered most: features from Fz, a midline electrode on the front of the scalp, carried the most weight in the model.1
- Not ready for clinics: there was no outside test group, and the children with ADHD had already taken methylphenidate (Ritalin).1
How Researchers Turned Children’s EEG Into ADHD Predictions
Electroencephalography (EEG) records the brain’s electrical rhythms through small electrodes placed on the scalp. It is cheap, painless and works well with children, which is why researchers keep asking whether it could add objective information to an ADHD evaluation.
Gutiérrez-Jácome et al. reanalyzed a public dataset of 121 children: 61 diagnosed with ADHD by an experienced psychiatrist using DSM-IV criteria, and 60 with no psychiatric disorder, epilepsy or reported high-risk behavior.1
Recording: 19 scalp electrodes, sampled 128 times per second, while each child counted cartoon characters (5 to 16 per picture) on a screen.
Features: each recording was cut into overlapping 4-second slices. For every electrode, the researchers measured the signal’s average and spread plus its power in 3 rhythm bands:
- Theta (4 to 8 Hz), slower waves often linked to drowsiness
- Alpha (8 to 13 Hz), the idling rhythm of a relaxed brain
- Beta (13 to 30 Hz), faster waves linked to active focus
That gave 95 numbers per slice. Four kinds of classifier (software that learns to sort examples into groups) were trained on them: Random Forest, a support vector machine, Gradient Boosting and logistic regression.1
Why Each Child Stayed on One Side of the Test
One 4-second slice of a child’s EEG looks a lot like the next slice from the same child. If slices from one child land in both the training and test sets, a model can learn to recognize that particular child instead of ADHD. This problem is called data leakage, and it inflates accuracy.
To prevent it, the researchers used subject-wise cross-validation: the children were split into 5 groups, and each group was tested by a model trained only on the other 4. Every child’s slices stayed together.1
Random Forest Reached 81% Accuracy, but 3 Models Were Statistically Tied
Random Forest had the best overall numbers: 81% accuracy, 84% sensitivity (children with ADHD correctly flagged) and 78% specificity (children without ADHD correctly cleared). Its bootstrap 95% range ran from 74% to 88%.1
The support vector machine caught the most children with ADHD (85% sensitivity) and had the highest area under the curve (AUC), 0.85. AUC measures how well a model ranks children across all cutoffs; 0.5 is a coin flip and 1.0 is perfect.1
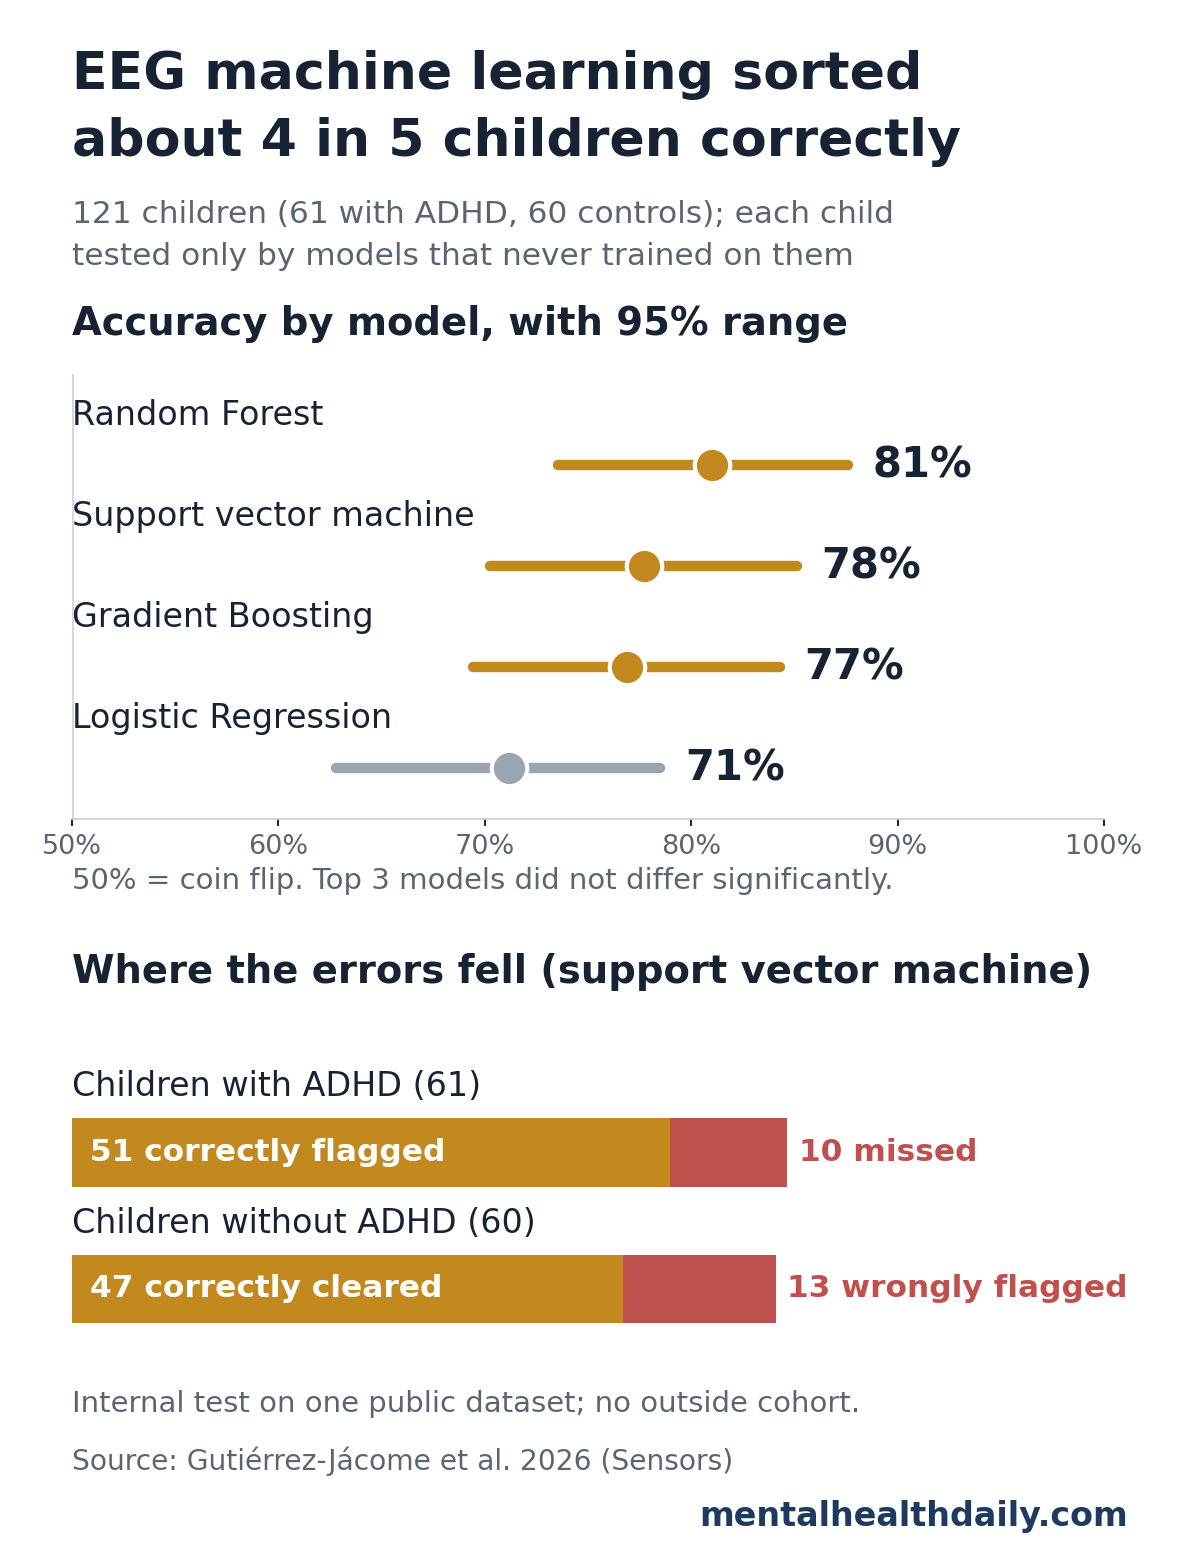
Statistical comparison: a Friedman test found an overall difference among the 4 models (p = 0.0046). Pairwise tests showed that difference came from logistic regression trailing Random Forest (p = 0.0047) and the support vector machine (p = 0.0114). Random Forest, the support vector machine and Gradient Boosting were statistically tied.1
Child-by-child errors: in a separate leave-one-child-out test of the support vector machine, the model got 98 of 121 children right. It missed 10 of 61 children with ADHD and wrongly flagged 13 of 60 children without ADHD.1
Frontal Electrodes, Especially Fz, Carried the Most Weight
The researchers asked the Random Forest which electrodes it leaned on most. Fz, on the midline of the front of the scalp, ranked first, followed by F3, Fp1 and F7 on the left front of the head. Fp2, F4 and F8 ranked lower.1
Frontal brain regions handle attention, planning and impulse control, the executive functions that ADHD affects. Still, these rankings show what the software found useful. They are not measurements of brain activity, and the researchers say so directly.1
Eye-movement caveat: the pipeline did not use advanced cleanup such as independent component analysis. Eye blinks and forehead muscle tension show up most at frontal electrodes, so some of the frontal signal could reflect muscle tension or eye movement rather than brain rhythms.1
A 2025 Korean study of 168 children (107 with ADHD, 61 without) pointed somewhere else. Its model, built on resting eyes-closed EEG, relied most on beta activity at O1, an electrode over the back of the head.2 Different tasks and recording setups can lead models to very different “important” regions.
Why Earlier EEG Studies Reported Higher ADHD Accuracy
Several earlier EEG models for ADHD reported accuracy between 86% and 96%, often with looser testing, such as scoring individual EEG slices instead of whole children.1
A 2017 analysis by Saeb et al. showed why that matters in clinical machine learning: splitting records instead of people can greatly overestimate how well a model will work on someone new.3 The 81% figure from the stricter 2026 design is a more realistic estimate for new children from the same dataset.
Strict testing can still produce higher numbers in a different sample. The Korean study also held out one child at a time and reported 90.81% accuracy in its own clinic sample, which used different equipment, resting eyes-closed recordings and ages 8 to 15.2 Neither model has been tested on the other’s children.
Can an EEG Test Diagnose ADHD?
Not yet. ADHD is diagnosed through clinical interviews, parent and teacher reports and DSM-5 criteria, and the 2026 researchers describe their framework as exploratory, not diagnostic.1
EEG markers have a history of fading under closer study. The best known is the theta/beta ratio, the balance of slow theta waves to faster beta waves.
- 2013 meta-analysis: across 9 studies (1,253 children and teens with ADHD, 517 without), Arns et al. found a sizable average difference but large disagreement between studies and shrinking effects over time.4
- 2026 multiverse analysis: testing 576 reasonable analysis choices in 2 independent datasets (1,499 and 381 participants), Strzelczyk et al. found no reliable theta/beta difference by diagnosis.5
The Strzelczyk team traced apparent differences to background (aperiodic) EEG activity and to each person’s individual alpha frequency, the exact speed of their dominant alpha rhythm.5
The 2026 Sensors study also checked individual alpha frequency. The average was nearly identical in the two groups (8.83 Hz with ADHD, 8.88 Hz without). Redefining each child’s bands around it lowered accuracy for every model; Random Forest dropped from 81% to 73%.1
Limitations of This EEG ADHD Classification Study
- No outside test. All results come from internal cross-validation on one public dataset of 121 children. How the models would perform with another clinic’s children and equipment is unknown.
- Medication confound. Children with ADHD had taken methylphenidate (Ritalin) for up to 6 months; controls had not. The models could partly be detecting medication effects on EEG.
- ADHD vs. typical children only. Real clinics need to tell ADHD apart from anxiety, learning disorders, sleep problems and other conditions, which this design did not test.
- Older diagnostic criteria. Diagnoses followed DSM-IV, and the exact sex split was not reported, though the groups were described as moderately unbalanced.
- Uneven recording length. Recording time depended on how fast each child counted, so children with ADHD contributed more slices on average (75 vs. 56).
- Wide uncertainty. With 121 children, the 95% range for the best model spans 74% to 88%.
The 2026 study shows what simple EEG features can do when leakage is controlled. The next step is testing the same pipeline on children from other clinics, including unmedicated children and children with other conditions.
References
- Gutiérrez-Jácome DB, Campos-Ortuño RA, Pardo-Valenzuela JE, Gómez-Morales ÓW. Neurophysiological characterization of ADHD in children using EEG signals: a machine learning approach to executive function networks. Sensors. 2026;26:5684. doi:10.3390/s26175684
- Kim JW, Kim BN, Kim JI, Yang CM, Kwon J. Electroencephalogram (EEG) based prediction of attention deficit hyperactivity disorder (ADHD) using machine learning. Neuropsychiatric Disease and Treatment. 2025;21:271–279. doi:10.2147/NDT.S509094
- Saeb S, Lonini L, Jayaraman A, Mohr DC, Kording KP. The need to approximate the use-case in clinical machine learning. GigaScience. 2017;6(5):1–9. doi:10.1093/gigascience/gix019
- Arns M, Conners CK, Kraemer HC. A decade of EEG theta/beta ratio research in ADHD: a meta-analysis. Journal of Attention Disorders. 2013;17(5):374–383. doi:10.1177/1087054712460087
- Strzelczyk D, Vetsch A, Langer N. Theta beta ratio in attention deficit hyperactivity disorder using a multiverse analysis. eLife. 2026;15:RP111114. doi:10.7554/eLife.111114