Ultra-processed food made up almost half the daily calories of 128 Saudi children and teens with ADHD in a 2026 survey study.1
Their quality of life was well below published norms, but kids who ate more ultra-processed food did not report a worse quality of life than kids who ate less.1
Research Highlights
- Half the calories: ultra-processed foods supplied an average of 48.8% of daily calories, and unprocessed or minimally processed foods supplied 39.8%.1
- Low quality-of-life scores: total scores averaged about 58 out of 100 in both the kids’ own ratings and their parents’ ratings, against healthy norms of 84 and 82.1
- No link between the two: the share of calories from ultra-processed food was not correlated with quality of life overall or in any of its 4 areas (physical, emotional, social and school).1
- Parent education stood out: kids of mothers and fathers with more schooling had higher quality-of-life scores.1
- One snapshot in time: the cross-sectional design, with no adjustment for ADHD severity or other factors, cannot show whether changing diet would change how kids feel or function.1
How Researchers Measured Diet and Quality of Life in Kids With ADHD
Attention-deficit/hyperactivity disorder (ADHD) is a neurodevelopmental condition marked by ongoing inattention, hyperactivity and impulsivity. It usually starts in childhood and can affect schoolwork, friendships and family life.
A team led by Lina Alwaili and Abeer Alzaben at Princess Nourah bint Abdulrahman University in Riyadh enrolled children and teens aged 8 to 18 with an ADHD diagnosis between January 2024 and December 2025. Families were recruited through the Saudi ADHD Society (the Ishraq Association) and King Abdullah bin Abdulaziz University Hospital.1
Of 145 families who completed the online survey, 17 were dropped for implausible answers: 16 reported daily calorie totals below 500 or above 5,000, and 1 reported an impossible height and weight. That left 128 kids for analysis.1
- Age: 11.5 years on average
- Sex: 85 boys and 43 girls
- ADHD medication: 61 kids (47.7%): methylphenidate for 37, atomoxetine for 15 and other drugs for 15
- Location: 73% lived in Saudi Arabia’s central region, which includes Riyadh
- Who answered: mostly mothers (93 surveys), followed by fathers (16) and the kids themselves (14)
What Counts as Ultra-Processed Food
Researchers sorted every food into the 4 groups of the NOVA classification, a widely used system that ranks foods by how much industrial processing they go through rather than by their nutrients:1
- Unprocessed or minimally processed foods: fruit, vegetables, eggs, fresh meat, milk and plain grains, eaten as they are or with small changes
- Processed culinary ingredients: oils, sugar and salt used in home cooking
- Processed foods: simple foods made by adding those ingredients to group 1 foods, such as canned goods, cheese and freshly made bread
- Ultra-processed foods: industrial products made from many ingredients and additives, designed for convenience, taste and long shelf life
Diet came from a validated Saudi food frequency questionnaire, which asks how often a child ate each of a long list of foods over the past year. Parents completed it, and software converted the answers into daily calories.1
How Quality of Life Was Scored
Quality of life was measured with the Pediatric Quality of Life Inventory (PedsQL), a 23-question survey covering physical, emotional, social and school functioning. Answers are converted to a 0-to-100 scale where higher scores mean a better quality of life.
Kids filled out their own version, and parents filled out a matching version about their child. The 2 sets of answers agreed closely (correlation above 0.80).1
Ultra-Processed Food Supplied Nearly Half of Kids’ Calories
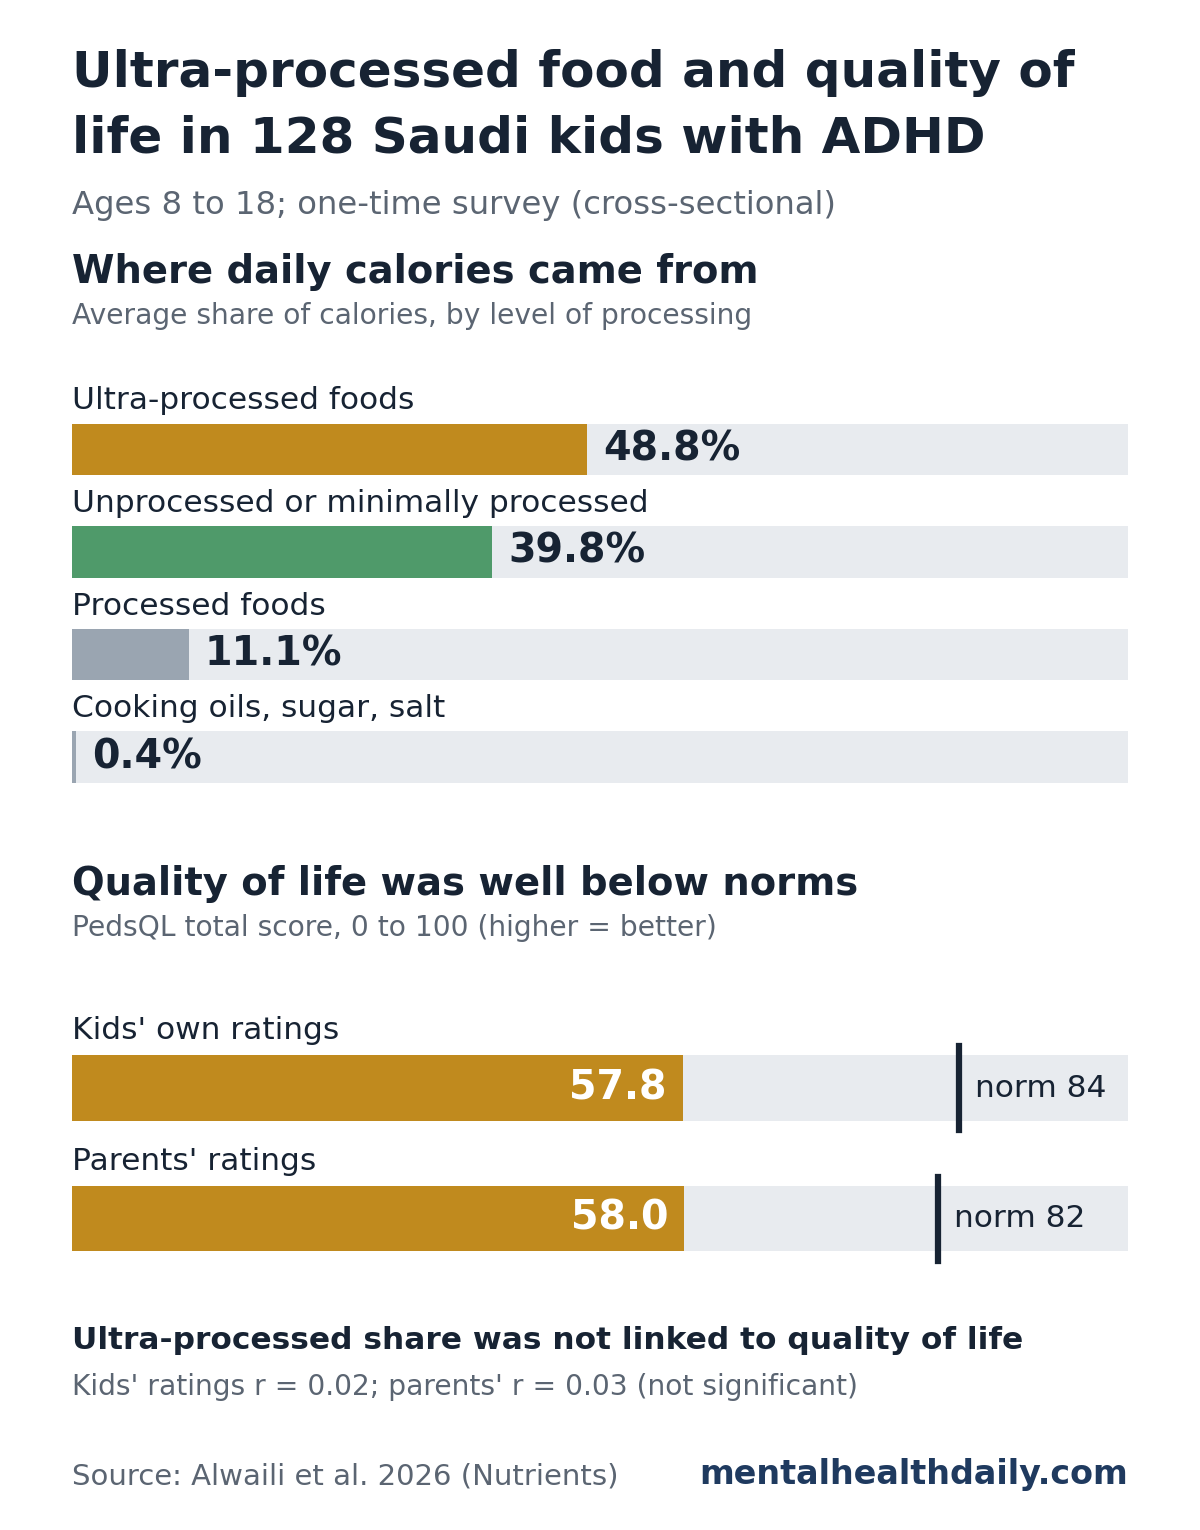
On average, the kids got 48.8% of their calories from ultra-processed foods. Unprocessed or minimally processed foods supplied 39.8%, processed foods 11.1% and added cooking ingredients 0.4%.1
That share barely moved across groups. Ultra-processed intake did not differ significantly by sex, region, household income, parents’ education, number of siblings, medication use or time since diagnosis.1
A high intake fits earlier research. A Spanish case-control study of 120 children found that those newly diagnosed with ADHD ate more sugar, candy and soft drinks, ate fast food more often and followed a Mediterranean-style diet less closely than matched children without ADHD.2
A nationally representative Israeli survey of 1,135 children aged 6 to 11 found that the 111 with ADHD were more likely to eat above-median amounts of ultra-processed food, even after adjusting for age, sex, socioeconomic status and calorie intake.3 Its researchers noted the link could run in either direction.
Quality of Life Was Low, but Not Linked to Ultra-Processed Food
Total quality-of-life scores averaged 57.8 in kids’ own ratings and 58.0 in parents’ ratings. Both were far below the healthy norms of 84 and 82 from a large US reference sample (p < 0.0001).1
School was the hardest area. School functioning scored lowest and physical functioning highest, in both kids’ and parents’ ratings:1
- School: 48.8 (kids) and 48.1 (parents), against norms of 81 and 78
- Emotional: 49.8 and 51.0, against 79 and 81
- Social: 51.6 and 51.8, against 85 and 83
- Physical: 72.8 and 71.9, against 88 and 84
The main result was null. The share of calories from ultra-processed food showed essentially no correlation with total quality of life, whether kids rated it (r = 0.016, p = 0.85) or parents did (r = 0.034, p = 0.71). None of the 8 domain scores showed a significant link either.1
A correlation (r) runs from −1 to 1, and values this close to 0 mean that knowing a child’s ultra-processed share told researchers almost nothing about that child’s quality-of-life score.
Other research on teens without a specific diagnosis has found item-level links. In a study that followed 3,206 Chinese adolescents for a year, instant noodles, sugary drinks and fried foods were linked to lower quality of life, and fruit to higher quality of life.4 That study used a different questionnaire and looked at specific foods rather than total ultra-processed share.
Parents’ Education Was Linked to Higher Quality of Life
Among everything researchers compared, parents’ education was the only family factor linked to quality of life:1
- Mothers: kids whose mothers had not finished high school averaged about 42 (kids’ ratings) and 40 (parents’ ratings), against roughly 56 to 62 for every other education level. Only 8 kids were in that lowest group.
- Fathers: scores rose with fathers’ schooling, from about 50 (kids) and 49 (parents) when fathers had not finished high school to 64 and 66 with education beyond a bachelor’s degree.
Quality of life did not differ by sex, household income, medication use, medication type or time since diagnosis.1
Body weight: a higher BMI-for-age score (body mass index compared with other children of the same age and sex) was weakly linked to lower school functioning (r = −0.24 in kids’ ratings) and lower parent-rated total quality of life (r = −0.22). Higher BMI scores also had a borderline link with a smaller ultra-processed share (r = −0.18, p = 0.049).1
These were a few weak results among dozens of tests run without correction for multiple comparisons, and they relied on parent-reported heights and weights for 116 kids.
What This Cross-Sectional Study Can and Cannot Show
A cross-sectional study measures everything at a single point in time. It can describe how common something is and whether 2 measures rise and fall together, but it cannot show which came first or whether one causes the other.
Here, that means the study can show that ultra-processed food was a large part of these kids’ diets and that their quality-of-life scores were low. It cannot show whether cutting ultra-processed food would raise those scores, or whether it would make no difference.
The main limits, several of which the researchers named themselves:1
- ADHD severity was not measured. Kids with more severe symptoms may eat more ultra-processed food and also have lower quality of life, which could hide or distort a real link.
- No adjustment for other factors. Every comparison was a simple 2-way analysis, without accounting for income, education, medication or weight.
- Small, exploratory sample. With 128 kids and no advance power calculation, a modest link could have been missed.
- Parent-reported diet and growth. A food questionnaire covering a whole year can over- or underestimate intake, and heights and weights were not measured by staff.
- Narrow recruitment. Families came through an ADHD society and 1 hospital, mostly in the Riyadh region, and most parents had at least a bachelor’s degree.
- Outside comparison group. Quality of life was compared with published US norms, not with Saudi children recruited at the same time.
The paper also has small internal inconsistencies. One table lists medication-use counts swapped relative to the others, and the discussion says ultra-processed intake was not linked to body measures, though one table reports the weak BMI correlation described above.1
What Families of Kids With ADHD Can Take From This
Ultra-processed food was a large part of these kids’ diets, in line with earlier studies of children with ADHD.23 Lower quality of life, especially at school, was common regardless of diet.
The study offers no evidence either way on whether changing a child’s diet improves ADHD symptoms or daily life; that question needs trials that change diets and track outcomes over time.
A diet built mostly on minimally processed foods is still recommended for children’s general health. School and emotional struggles in kids with ADHD are worth raising with the child’s doctor or care team.
References
- Alwaili LM, Alsuhaibani NS, Alotaibi HK, et al. High ultra-processed food consumption but no association with quality of life in Saudi children and adolescents with ADHD. Nutrients. 2026;18(18):2977. doi:10.3390/nu18182977
- Ríos-Hernández A, Alda JA, Farran-Codina A, et al. The Mediterranean diet and ADHD in children and adolescents. Pediatrics. 2017;139(2):e20162027. doi:10.1542/peds.2016-2027
- Namimi-Halevi C, Dor C, Kaufman-Shriqui V, et al. Attention-deficit/hyperactivity disorder is associated with increased consumption of ultra-processed foods among children. Pediatric Research. Published online March 3, 2026. doi:10.1038/s41390-026-04844-5
- Yang Y, Gao Y, Yi X, et al. The impact of ultra-processed foods and unprocessed or minimally processed foods on the quality of life among adolescents: a longitudinal study from China. Frontiers in Nutrition. 2024;11:1489067. doi:10.3389/fnut.2024.1489067