Adding socioeconomic background to EEG brain recordings slightly improved how well a deep-learning model sorted 127 US university students by ADHD screening status. Accuracy rose on all 4 brain-recording tasks, but the gain was not statistically significant on any of them.1
Research Highlights
- About 9 in 10 classified correctly from EEG alone: tested on students it had never trained on, the EEG-only model matched each person’s ADHD screening result 86.4% to 90.5% of the time across 4 tasks.1
- Socioeconomic data added 3 to 5 points: with 17 socioeconomic answers added, accuracy rose to 91.5% to 95.8%, and none of the reported measures dropped below its EEG-only value.1
- The gain was not statistically confirmed: only 6 to 9 students per task changed classification, and paired McNemar tests gave p = 0.091 to 0.342.1
- Screening labels, not diagnoses: “ADHD” here meant scoring positive on a 6-question self-report screener, which cannot tell ADHD apart from anxiety, sleep or learning problems.1
- Near-perfect scores came from an easier test: when recordings from the same person could land in both training and testing, accuracy reached 97.6% to 99.9%, a known way machine-learning studies overstate performance.13
How the Study Combined EEG With Socioeconomic Background
Sadi et al., computer scientists at the University of Dhaka and East West University in Bangladesh, reanalyzed a public dataset collected at the University of Florida. It holds EEG recordings and socioeconomic questionnaires from 127 young adults aged 18 to 30 (average age 21, 57.5% female).12
EEG (electroencephalography) records the brain’s electrical activity through electrodes on the scalp. Here, students wore a 32-channel cap while doing 4 standard attention tasks:1
- Auditory oddball: press a button when a rare target tone appears among common tones (95 students analyzed)
- Visual oddball: the same idea with a rare target shape (84 students)
- Flanker: report the direction of a center arrow while ignoring the arrows beside it (60 students)
- Visual search: find a target letter among distractor letters (59 students)
Not every student did every task, and some lacked a screening answer, which is why each task had fewer than 127 people.1
The socioeconomic data came from 17 questionnaire items:1
- Childhood social standing: where students placed their family on a 10-step ladder at age 10
- Education: the student’s own and a parent’s highest level
- Food security: a 6-item US Department of Agriculture survey covering the past 12 months
- Home and neighborhood: 8 items on housing problems, street noise and how safe the area felt
The model had 3 parts working side by side. Two deep-learning networks read the raw EEG signal and a frequency-by-time picture of it, and a small network read the socioeconomic answers. An attention step then weighed and combined all 3. The socioeconomic part was tiny: 13,888 of 36.1 million settings, or 0.04%.1
ADHD Labels Came From a Self-Report Screener
Students counted as ADHD-screened-positive if they marked at least 4 of the 6 core questions on the World Health Organization Adult ADHD Self-Report Scale (ASRS) at the screening threshold. No clinical interview confirmed these labels.1
That screener is well studied. In its original validation against blind clinical interviews of 154 US adults, the 6-question version had 68.7% sensitivity (it caught about 2 in 3 people with ADHD) and 99.5% specificity (it rarely flagged people without it).5
So the model learned to predict a questionnaire result, not a diagnosis. The researchers stress this themselves: a positive screen can also reflect anxiety, sleep disorders or learning disabilities.1
Accuracy Rose on All 4 Tasks With Socioeconomic Data Added
The main test was leave-one-subject-out cross-validation. The model trained on every student except one, then classified that held-out student from a majority vote across short segments of their EEG. This repeated until everyone had been the held-out person, so the model never saw the test student’s data during training.1
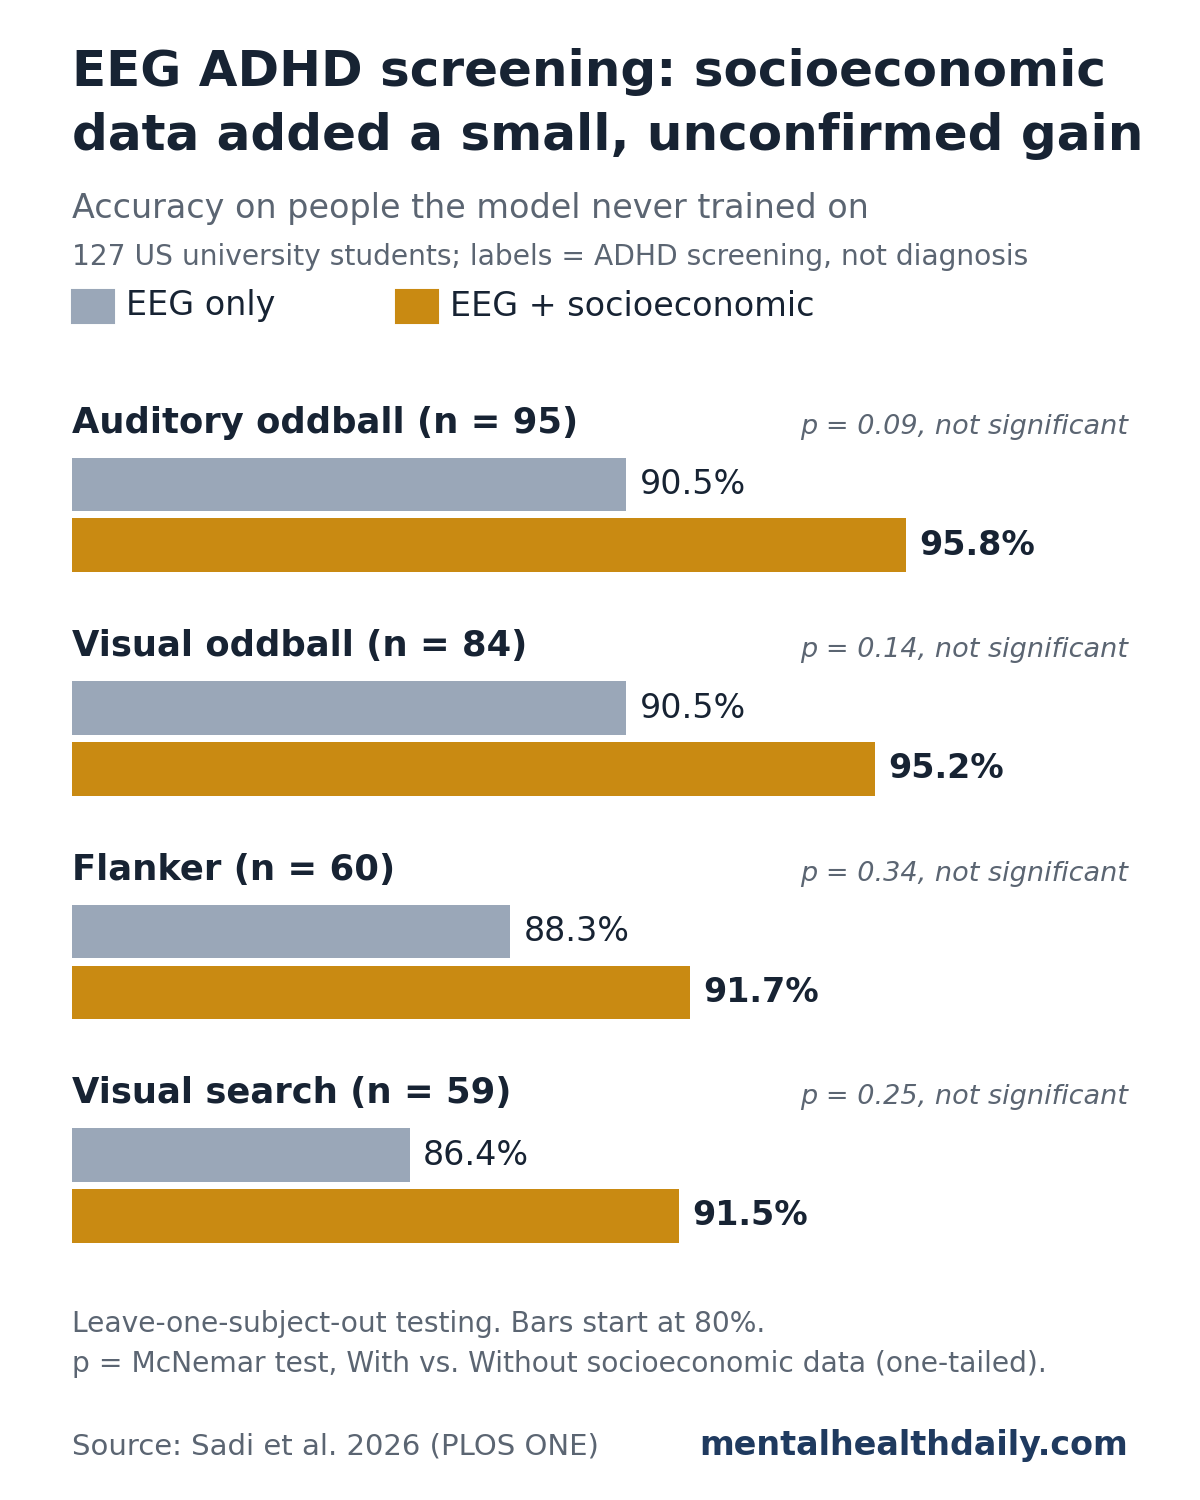
With socioeconomic data, the model’s sensitivity (share of screen-positive students it caught) ranged from 0.71 to 0.96, up from 0.65 to 0.85 with EEG alone. Its specificity (share of screen-negative students it correctly cleared) ranged from 0.95 to 1.00.1
The visual search task showed how the gain could come from fewer false alarms alone. The same 13 screen-positive students were caught with or without socioeconomic data; specificity rose from 0.90 to 0.98.1
Why the Socioeconomic Gain Is Not Yet Confirmed
To check whether the 2 versions of the model really differed, the researchers used McNemar’s test, which looks only at people the 2 versions classified differently. On the auditory oddball task, 7 students switched to a correct call with socioeconomic data and 2 switched to a wrong one (p = 0.091).1
The other tasks were further from significance: p = 0.144 for visual oddball, 0.252 for visual search and 0.342 for flanker. Only 6 to 9 students per task changed classification, far too few for the test to confirm a difference.1
The researchers see the gain on every task as a sign the benefit is real and say a larger multi-site study is needed to confirm it.1
Near-Perfect Scores Came From an Easier Test
The researchers also ran a second test that split 4-second EEG segments, not people, into training and test sets. Segments from the same student could end up on both sides. Under that setup, the socioeconomic model scored 97.6% to 99.9%.1
Those figures overstate real-world performance, and the researchers treat them only as a way to compare model designs. A 2017 analysis in GigaScience showed why: when a model sees a person’s data during training, it can partly recognize the person rather than the condition, inflating accuracy. Testing on held-out people avoids that problem.3
EEG Model Reached 80% Accuracy in Children With Diagnosed ADHD
To see whether the EEG part worked beyond college students, the researchers applied it unchanged to a separate public dataset of 121 children aged 7 to 12: 61 with clinically diagnosed ADHD and 60 without.1
- Held-out children: 80.4% accuracy (±6.4%), above the 76.1% reported by an earlier study using the same strict approach
- Segment-level testing: 97.5% to 97.9%, again showing a gap of about 17 to 18 points between the easy and strict tests
- What it could not test: that dataset had no socioeconomic information, so the full model has never been checked outside the original sample
Childhood Social Standing Was the Strongest Socioeconomic Signal
Using SHAP, a method that estimates how much each input pushed a prediction up or down, the researchers ranked the socioeconomic items. Across 8 analyses (4 tasks, 2 testing methods):1
- Childhood social standing ranked at or near the top in 7 of 8, with lower standing linked to a positive screen.
- Neighborhood safety landed in the top 15 in 6 of 8, with safer neighborhoods linked to a negative screen.
- Food security and education also appeared across tasks, with a bachelor’s degree or higher generally linked to a negative screen.
These are associations inside one screening dataset, not causes. The researchers also flag an equity risk: if self-reported screening labels already carry socioeconomic bias, a model could learn to link low socioeconomic status to ADHD and repeat that bias. They ran no fairness analysis.1
Earlier Research on EEG Markers and Socioeconomic Links to ADHD
EEG markers have a mixed record. A 2013 meta-analysis of 9 studies (1,253 children and teens with ADHD, 517 without) found that a higher theta/beta ratio, a once-popular EEG marker, could not be considered a reliable diagnostic measure of ADHD, though a substantial subgroup with ADHD did show high values.4
Socioeconomic links are well established. In a UK birth cohort of 8,132 children, financial difficulties in early childhood were the strongest socioeconomic predictor of an ADHD research diagnosis at age 7 (odds ratio 2.23, 95% CI 1.57 to 3.16).6
The 2026 study is the first, by the researchers’ account, to feed both kinds of information into one machine-learning screening model.1
Limitations of This EEG and Socioeconomic ADHD Model
- Screening labels: every result rests on a self-report screener, not clinical diagnosis.
- Small, narrow sample: 59 to 95 university students per task, from one US site, with few screen-positive students in each.
- No confirmed socioeconomic benefit: the gain was not statistically significant on any task.
- No outside test of the full model: only the EEG part was tried on another dataset.
- Recall and confounding: childhood socioeconomic status was remembered, not recorded, and sleep, medication and other psychiatric conditions were not accounted for.
What This Means for ADHD Screening
This is a proof of concept, not a test you can get. The researchers describe the model as a possible screening-support tool that might one day flag people for a full clinical evaluation, not something that diagnoses ADHD.1
Brief questionnaires are cheap to add. Socioeconomic questions take little time, so if larger studies confirm the gain, adding them to EEG screening would cost little. The next steps are clinic-referred patients with confirmed diagnoses and checks that the model treats people from different backgrounds fairly.1
ADHD diagnosis still runs through a clinician. Anyone concerned about attention problems can start with a screener like the ASRS, but a positive result is a reason for a full evaluation, not a diagnosis.5
References
- Sadi SH, Hossain MA, Tawhid MNA. Integrating socioeconomic context with multimodal EEG data for improved ADHD risk screening. PLOS ONE. 2026;21(9):e0357213. doi:10.1371/journal.pone.0357213
- Isbell E, Peters AN, Richardson DM, Rodas De León NE. Cognitive electrophysiology in socioeconomic context in adulthood. Scientific Data. 2025;12(1):841. doi:10.1038/s41597-025-05209-z
- Saeb S, Lonini L, Jayaraman A, Mohr DC, Kording KP. The need to approximate the use-case in clinical machine learning. GigaScience. 2017;6(5):gix019. doi:10.1093/gigascience/gix019
- Arns M, Conners CK, Kraemer HC. A decade of EEG theta/beta ratio research in ADHD: a meta-analysis. Journal of Attention Disorders. 2013;17(5):374–383. doi:10.1177/1087054712460087
- Kessler RC, Adler L, Ames M, et al. The World Health Organization Adult ADHD Self-Report Scale (ASRS): a short screening scale for use in the general population. Psychological Medicine. 2005;35(2):245–256. doi:10.1017/s0033291704002892
- Russell AE, Ford T, Russell G. Socioeconomic associations with ADHD: findings from a mediation analysis. PLOS ONE. 2015;10(6):e0128248. doi:10.1371/journal.pone.0128248