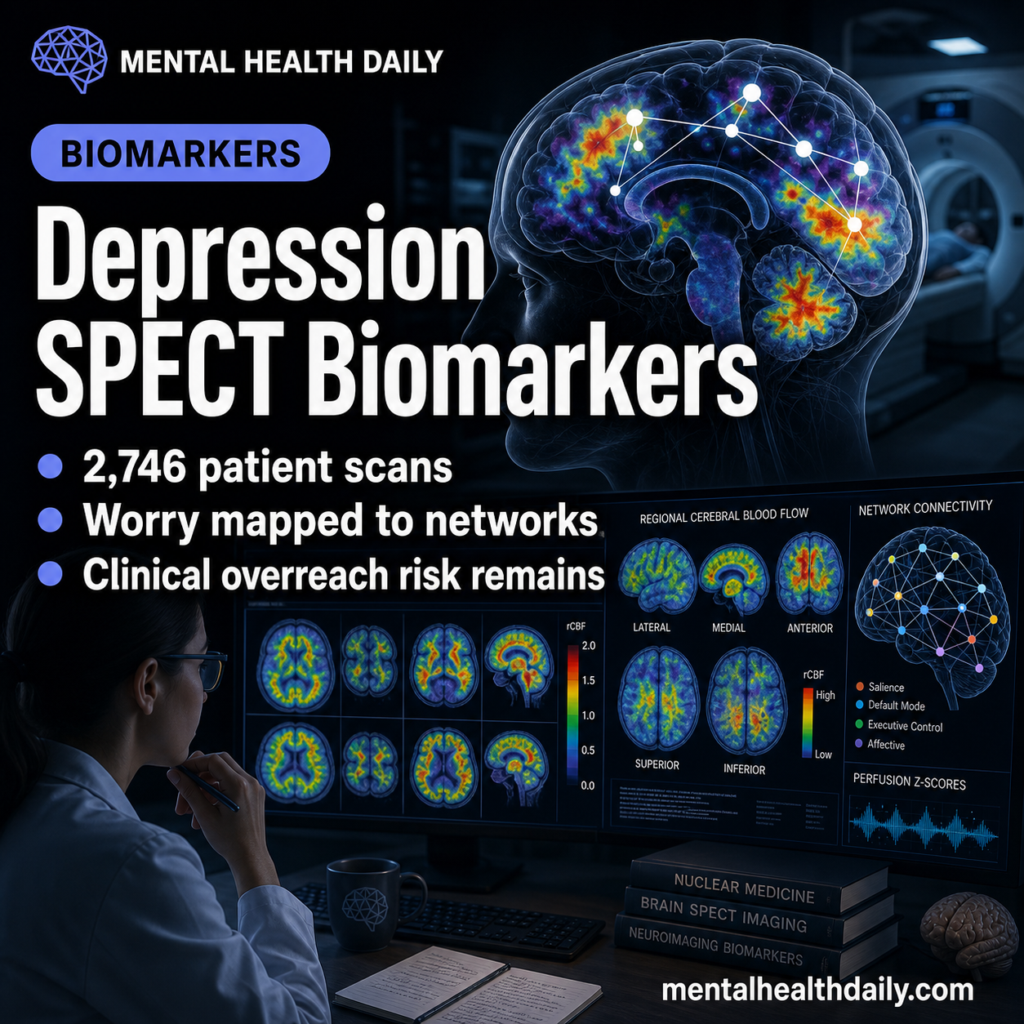
A 2026 medRxiv preprint used 68 NeuroMark SPECT components to analyze 2,746 psychiatric patient scans and 76 controls, linking depression-related worry/rumination and social disinterest to brain-network patterns.1 This preprint is useful as a large biomarker-generating map, but the clinical-diagnostic claim needs much more caution than the sample size alone suggests.
Research Highlights
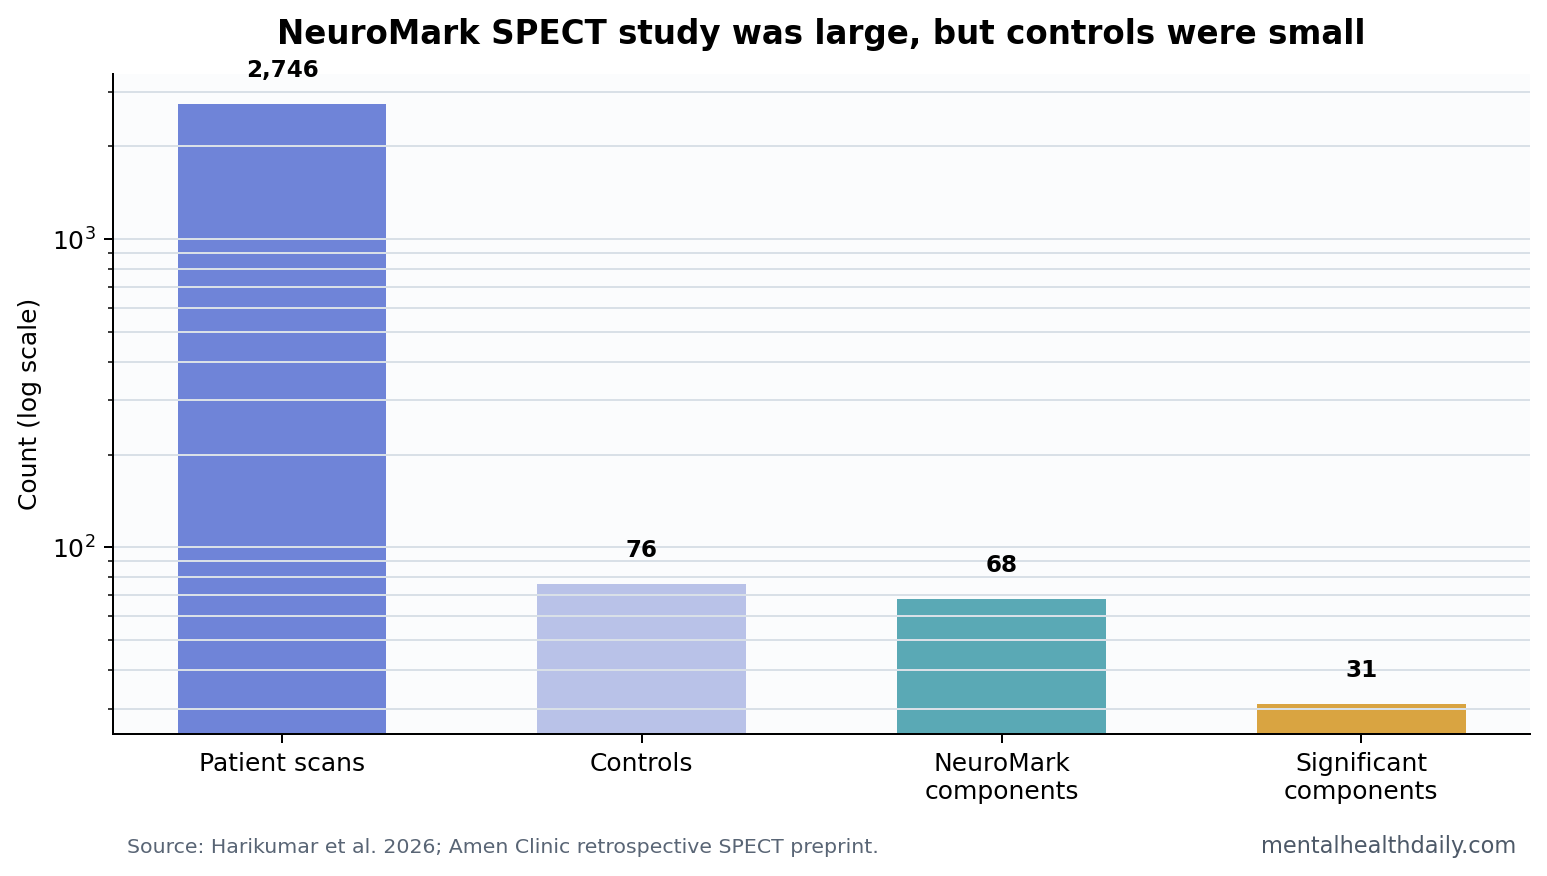
- Large clinical SPECT sample: researchers analyzed 2,746 Amen Clinic patient scans plus 76 controls using a 68-component NeuroMark SPECT template.1
- Patient-control map was broad: 31 components differed across 13 NeuroMark domains or subdomains, spanning cerebellar, subcortical, temporal, and visual networks.1
- Worry and rumination had network links: depression-related worry/rumination correlated with several NeuroMark component patterns, including hippocampal-frontal and sensorimotor directions.1
- Moodiness was weaker: no moodiness-associated components survived FDR correction, which makes the 3-symptom profile uneven rather than uniformly positive.1
- Clinical translation remains early: the paper is a preprint, the control sample was only 76 people, and the data came from a specialized clinical SPECT setting.1
SPECT stands for single-photon emission computed tomography, a nuclear-imaging method that estimates regional cerebral blood flow. In psychiatry, the central question is whether perfusion patterns can add useful information beyond symptoms, history, and ordinary clinical assessment.
NeuroMark is an independent-component-analysis template that breaks brain scans into reproducible network components. In this paper, the researchers applied a 68-component SPECT version of that template to a retrospective clinical dataset.
2,746 Patient Scans Create Power and Bias at the Same Time
The headline strength is scale. The analysis used 2,746 patient scans from an initial Amen Clinic pool, with patients grouped across anxiety, autism, attention-deficit/hyperactivity disorder, bipolar disorder, depression, and schizotypal personality profiles. It also included 76 healthy controls.1
Scale helps because depression-related brain-imaging effects are usually noisy. A small SPECT study can mistake sampling noise for a subtype. A 2,746-person patient dataset has more power to detect stable patterns.
Scale also creates a trap. A large specialty-clinic sample is not the same as a population sample, a primary-care sample, or a medication-naive research cohort. The clinical setting, referral pathway, scan protocol, comorbidities, and business model all shape what appears in the dataset.
Worry and Social Disinterest Mapped Better Than Moodiness
The study focused on 3 depression-related clinical profiles: worry/rumination, moodiness, and social disinterest. Worry/rumination refers to repeated negative thought loops. Social disinterest overlaps with anhedonia, low social motivation, and reduced engagement.
Worry/rumination showed several component associations. The paper reported positive associations with some cerebellar and sensorimotor components, while hippocampal-frontal, hippocampal-temporal/parietal, and sensorimotor components showed negative associations in other directions.1
Social disinterest also produced a signal, including component 55 in the temporal-salience area. By contrast, moodiness did not produce significant components after false-discovery-rate correction. False-discovery-rate correction is a multiple-testing adjustment that reduces the chance of treating random findings as real when many brain components are tested.
That uneven pattern is important. The result is not “SPECT maps depression” in a global sense. It is closer to: some symptom dimensions showed component associations in this dataset, while at least 1 common affective profile did not survive correction.
31 Components Differed Across 13 NeuroMark Domains
Patient-control comparisons were broad. Harikumar et al. reported 31 components with significant group differences across 13 NeuroMark domains or subdomains. The paper described differences involving cerebellar, hippocampal, subcortical, temporal, and visual networks.1
For readers, the useful translation is simple: this was not a single “depression spot” in the brain. It was a distributed perfusion-network pattern across many components. That fits modern depression biology, where mood symptoms, cognition, motivation, interoception, sleep, and stress regulation depend on interacting systems.
Prior SPECT literature has long struggled with heterogeneity. Goozee et al. reviewed SPECT findings in depression and found that perfusion results varied across methods, populations, and regions.2 The NeuroMark approach tries to solve part of that problem by using a standardized network template rather than isolated hand-picked regions.
Amen Clinics Data Need a Clear Conflict-and-Setting Read
The Amen Clinics source matters. The dataset is large and clinically rich, but it comes from a commercial clinical environment where SPECT has been used as part of psychiatric assessment. That does not invalidate the analysis. It changes the level of proof required before the findings should influence practice.
Ascertainment issue: people who receive SPECT at a specialty clinic may differ from ordinary depression patients in illness complexity, financial resources, treatment history, referral motivation, and comorbidity. Those differences can shape both symptoms and scans.
Control imbalance: 2,746 patients were compared with only 76 controls. A small control group can make patient-control differences harder to interpret, especially when controls came from a narrower source than patients.
Preprint status: the paper had not been peer reviewed. Its own preprint notice states that the findings should not guide clinical practice. That caveat belongs near the center of any honest read.
Clinical Use Requires Prediction and Treatment Selection
Associating SPECT components with symptom scores is weaker than predicting treatment response, diagnosis, prognosis, or remission. A clinical biomarker has to change decisions. It should identify who needs a different treatment, who is at higher risk, or who belongs to a biologically meaningful subgroup with improved outcomes under a specific intervention.
NeuroMark has a stronger methodological foundation in network reproducibility than a purely ad hoc region-of-interest map.3 That helps the science. It does not skip the validation steps needed for individual patients.
- Supported claim: retrospective SPECT networks correlate with some depression-related symptom profiles in a large clinical dataset.
- Unsupported claim: SPECT can diagnose depression subtypes or choose treatment for an individual patient from this paper alone.
- Next validation step: external cohorts, blinded prediction, prospective outcome links, and transparent conflict-of-interest handling.
Treatment Selection Is the Higher Bar
Depression biomarkers become clinically useful when they improve treatment selection. A scan pattern should tell a clinician something actionable: which medication class is more likely to work, whether psychotherapy should be first-line, whether neuromodulation is a stronger match than another option, or whether a patient is at higher risk of nonresponse.
The NeuroMark SPECT preprint does not reach that bar. It maps symptom associations across diagnoses. That can generate hypotheses about transdiagnostic biology, especially for worry/rumination and social disinterest. It does not show that a SPECT component predicts who improves with SSRIs, ketamine, cognitive behavioral therapy, transcranial magnetic stimulation, sleep treatment, or exercise.
External validation is also essential. The same pipeline should be tested in non-Amen cohorts, ideally with blinded analysts, pre-registered outcomes, medication and comorbidity adjustment, and enough controls to make patient-control contrasts stable. Without that step, the scan map stays scientifically interesting but clinically underpowered.
Symptom specificity is another missing piece. Worry/rumination and social disinterest are not unique to major depression. They can appear in anxiety disorders, bipolar depression, autism, ADHD, trauma-related disorders, psychosis-spectrum states, chronic pain, sleep disorders, and medication side effects. A transdiagnostic imaging signal may be biologically meaningful, but it can also be clinically nonspecific unless it predicts a decision that ordinary symptom assessment cannot.
A narrower interpretation is stronger than a broad diagnostic claim. The preprint is most useful when read as a map of candidate perfusion networks that may track symptom dimensions across psychiatric labels.
It is weaker when framed as evidence that SPECT can classify depression, because the paper did not show blinded case classification against ordinary clinical assessment, treatment-response prediction, or a decision threshold a clinician could apply to one patient.1
Zheng et al. also illustrates why severity mapping and diagnosis should stay separate. Their BMC Psychiatry SPECT/CT study linked regional cerebral perfusion patterns with major-depression severity, which supports the idea that perfusion may carry state information.4 It still does not turn a scan into a stand-alone psychiatric diagnosis. Severity association, symptom-dimensional mapping, and validated individual prediction are separate evidentiary steps.
A useful prospective replication would start with a predefined symptom dimension, scan people before treatment, and test whether the NeuroMark component improves outcome prediction beyond baseline severity, diagnosis, age, medication status, and comorbidity. The threshold should be practical improvement: better prediction or better decisions beyond another statistically significant brain map.
The best use of this paper is hypothesis generation. It gives researchers candidate networks to test prospectively. It should not be used as proof that a paid SPECT scan can sort a depressed patient into a validated biological subtype.
The biology remains interesting when preliminary mapping is kept separate from clinical certainty.
That boundary protects both patients and legitimate biomarker research.
It also keeps future validation focused on outcomes patients can actually use.
Questions About Depression SPECT Biomarkers
Does this prove SPECT can diagnose depression?
No. The study found group and symptom associations. It did not validate SPECT as an individual diagnostic test.
What was the strongest finding?
The strongest practical finding was that worry/rumination and social disinterest showed NeuroMark component associations in a large patient sample, while moodiness did not survive correction.
Why does the Amen Clinics setting matter?
Because a specialty clinical SPECT database may not represent typical depression patients. Setting, referral, comorbidity, and clinical workflow can all influence the pattern.
References
- Harikumar A, et al. Examining comorbid and transdiagnostic depression clinical outcomes across anxiety, autism, attention deficit hyperactivity disorder (ADHD), bipolar disorder, depression, and schizotypal personality groups: a novel NeuroMark SPECT approach. medRxiv. 2026. doi:10.64898/2026.04.15.26350953
- Goozee R, Handley R, Kempton MJ, Dazzan P. A systematic review and meta-analysis of SPECT findings in depression. Neuroscience and Biobehavioral Reviews. 2014;43:118-136. https://doi.org/10.1016/j.neubiorev.2014.03.014
- Jing Y, et al. A NeuroMark framework for estimating reproducible brain networks. Translational Psychiatry. 2020;10:149. https://doi.org/10.1038/s41398-020-0834-6
- Zheng W, et al. Towards characterizing the regional cerebral perfusion in evaluating the severity of major depression disorder with SPECT/CT. BMC Psychiatry. 2018;18:70. https://doi.org/10.1186/s12888-018-1654-6