A 2026 medRxiv preprint found that a training-free speech biomarker tracked dysarthria severity across 890 speakers, 10 corpora, and 5 full-pipeline languages, with all 5 consonant d-prime features showing random-effects correlations with clinical severity (rho = −0.50 to −0.56; all p < 2e−4).
Research Highlights
- Speech-severity signal was broad: Muller et al. evaluated 890 speakers across 10 corpora; 867 speakers had enough aligned speech for feature-level consonant analyses.1
- Consonant separation tracked severity: all 5 consonant d-prime features correlated negatively with ordinal dysarthria severity, with pooled Spearman rho values from −0.47 to −0.55.1
- Cross-language direction held: nasality, stridency, and sonorant separation decreased from control to severe groups across English, Spanish, Dutch, Mandarin, and French, even though the tested HuBERT model was trained on English speech.1
- Severe-case screening looked strongest: stridency d-prime detected severe dysarthria with AUC = 0.890, 85% sensitivity, and 82% specificity at the reported threshold.1
- Clinical use is not ready: the preprint still needs peer review, standardized recording protocols, site-specific calibration, and disease-specific cohorts larger than the current amyotrophic lateral sclerosis sample.1
Dysarthria is impaired speech production caused by nervous-system injury or disease. It can follow Parkinson’s disease, amyotrophic lateral sclerosis, cerebral palsy, stroke, and other conditions, and clinicians usually judge its severity by listening for imprecise consonants, abnormal voice quality, nasal leakage, slowed rhythm, and reduced intelligibility.
The useful part of the 2026 preprint is not that it replaces a speech-language pathologist. It tries to turn several clinician-like observations into measurable speech features that can be computed without training a new model on labeled dysarthric speech.
Training-Free Speech Analysis Tracked Dysarthria Severity Across 10 Corpora
Training-free means the researchers did not train a supervised severity classifier on dysarthric recordings. Instead, they used healthy control speech to estimate phonological contrast directions inside HuBERT, a self-supervised speech model that learns speech representations from audio before being adapted to specific tasks.1,5
Phonological subspaces are regions or directions inside the model’s embedding space that separate speech-sound categories. In this project, the key question was whether contrasts such as nasal vs. oral consonants, voiced vs. voiceless consonants, or fricatives vs. other consonants become less separable as dysarthria worsens.
The analysis used Montreal Forced Aligner, a tool that aligns spoken audio to the expected sequence of speech sounds, then computed 12 speaker-level metrics. Five were consonant d-prime features, 4 were vowel d-prime features, and the rest captured boundary sharpness, cross-position similarity, and vowel-space geometry.1,6
- Scale: 890 speakers entered the severity evaluation, and 867 remained in feature-level analyses after low-alignment exclusions.
- Languages: the full pipeline covered English, Spanish, Dutch, Mandarin, and French.
- Clinical groups: datasets included Parkinson’s disease, cerebral palsy, amyotrophic lateral sclerosis, stroke, Down syndrome, mixed dysarthria, and healthy controls.
- Severity coding: corpora used different clinical labels, so the study mapped speakers onto control, mild, moderate, and severe categories.
That mapping is both a strength and a weakness. It made a large multi-corpus analysis possible, but it also means the severity scale was stitched together from non-identical clinical instruments and datasets.
Consonant d-Prime Was the Core Severity Signal
D-prime is a signal-detection measure of separation: higher values mean 2 categories are easier to tell apart, while lower values mean they overlap more. In speech terms, lower nasality d-prime means the model sees nasal and oral consonants as less cleanly separated in that speaker’s audio.
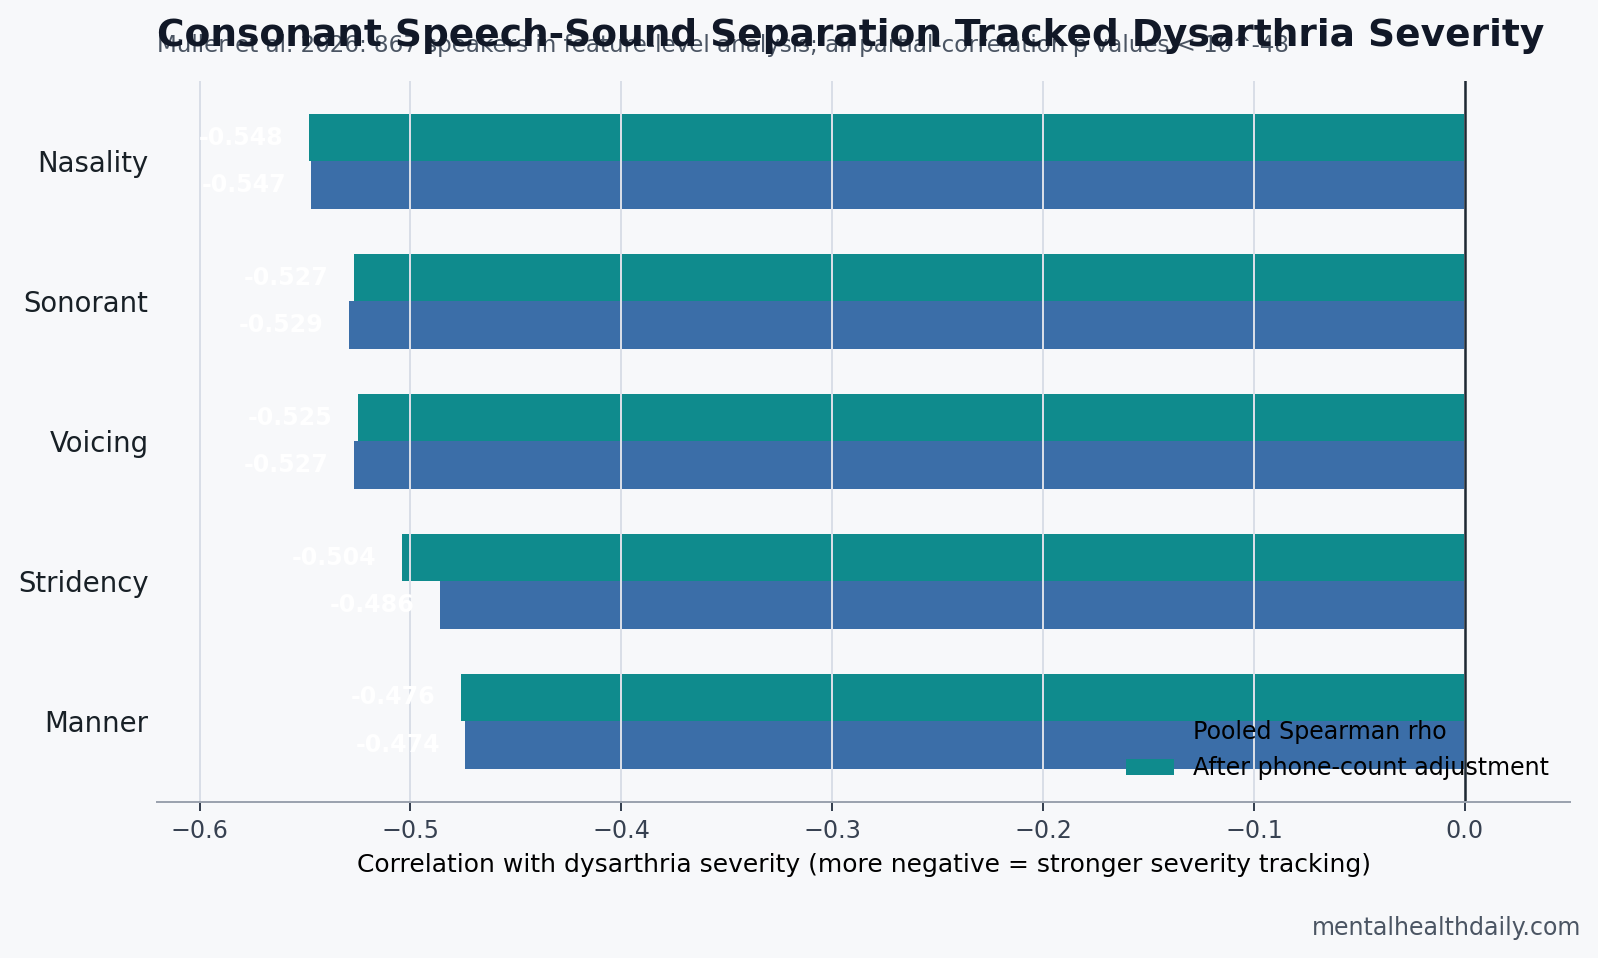
All 5 consonant features moved in the expected direction. As dysarthria severity increased, consonant category separation decreased.
- Nasality: pooled rho = −0.547; partial rho after controlling for phone count = −0.548.
- Sonorant: pooled rho = −0.529; partial rho = −0.527.
- Voicing: pooled rho = −0.527; partial rho = −0.525.
- Stridency: pooled rho = −0.486; partial rho = −0.504.
- Manner: pooled rho = −0.474; partial rho = −0.476.
The partial-correlation check matters because d-prime estimates are biased by the number of phone tokens available. Healthy-control d-prime values increased when speakers had more analyzable phones, which could have created a fake severity signal if severe speakers simply had fewer tokens. Muller et al. reported that controlling for phone count left the consonant correlations essentially unchanged, and stridency became slightly stronger.1
Control-vs.-severe group separation was also strong. All 12 features distinguished controls from severely dysarthric speakers at p < 0.001, and all d-prime features had large Cliff’s delta effect sizes above 0.63. Stridency showed the largest group separation, with Cliff’s delta = 0.915.1
The Best Read Is Screening and Monitoring, Not Diagnosis
Automated dysarthria research has already shown that supervised speech models can classify severity. Kadirvelu et al., for example, reported 70.48% speaker-independent accuracy on English UA-Speech using wav2vec2 representations and triplet loss.2 Sapkota et al. later found that HuBERT layers carried severity-relevant signal on TORGO, but that work still stayed inside supervised or corpus-specific severity classification.1
Muller et al. changed the target. Their method is less like an opaque severity label and more like an articulatory profile: which speech-sound contrasts are collapsing, and by how much? That profile could be useful when the clinical question includes both overall severity and the specific speech subsystem that is changing.
Troeger et al. took another training-free route by using automatic speech recognition errors to estimate intelligibility across dysarthrias.3 That approach is practical, but it is closer to a global intelligibility score. A phonological profile could expose whether the problem is concentrated in nasality, voicing, stridency, vowel space, or another speech subsystem.
Screening numbers were encouraging but narrower than a diagnostic claim. For severe dysarthria vs. all other speakers, stridency d-prime reached AUC = 0.890, with 85% sensitivity and 82% specificity at d-prime = 1.43. For moderate-or-worse dysarthria, AUC values were lower, ranging from 0.727 to 0.764.1
Clinical implication: severe dysarthria may be easier for this type of feature geometry to detect than earlier or borderline impairment. The more valuable future use may be longitudinal monitoring within the same person and recording setup, where small directional changes could matter before a categorical severity label changes.
Cross-Language Direction Was Consistent, But Absolute Scores Were Not
Cross-language performance is the most interesting part of the preprint. The model was trained on English speech, yet consonant separation still decreased from control to severe groups across 5 full-pipeline languages.
The absolute values should not be overread. Mandarin controls had higher nasality d-prime than Spanish controls, and corpora with shorter recordings produced lower d-prime estimates even among healthy speakers. The preprint reported that PC-GITA had a median 296 phones per speaker and lower Spanish d-prime values than Neurovoz, which had a median 1,283 phones per speaker.1
That creates a practical rule:
- Within-corpus ranking is plausible: a lower d-prime value can help rank severity inside the same language, task, microphone setup, and calibration pipeline.
- Cross-site thresholds are not ready: one clinic’s d-prime scale may not match another clinic’s scale unless recording protocols or local healthy controls are standardized.
- Longitudinal tracking may be the strongest application: repeated recordings from the same person under the same conditions avoid much of the cross-site calibration problem.
Random-effects meta-analysis sharpened that calibrated read. All 5 consonant features remained significant under both DerSimonian-Laird and more conservative Hartung-Knapp-Sidik-Jonkman inference, but I² values of 87% to 92% showed high between-corpus heterogeneity. Direction was consistent; magnitude was not.1
Disease-Specific Speech Profiles Are Promising, But ALS Was Underpowered
The aetiology analysis was exploratory. A 12-metric phonological profile separated Parkinson’s disease, cerebral palsy, and amyotrophic lateral sclerosis with 45.2% accuracy, above the 33.3% chance baseline for a 3-class task. Cerebral palsy had the strongest recall at 76%, while Parkinson’s disease recall was 53%, and ALS discrimination was weak because the severity-labeled ALS sample was small.1
Parkinson’s disease pattern: correlations were moderate and distributed across consonant features, with rho values from −0.29 to −0.38. That fits hypokinetic dysarthria, where timing, loudness, pitch, and articulation can all be affected rather than one consonant contrast dominating.
Cerebral palsy pattern: correlations were stronger across consonants, from rho = −0.30 to −0.47, matching the broader articulatory impairment seen in many cerebral palsy speech datasets.
ALS pattern: nasality and sonorant trends were clinically plausible because bulbar ALS can affect velopharyngeal closure and resonance, but only 5 ALS speakers had severity-graded labels. The preprint’s ALS signal should be treated as a hypothesis for future longitudinal cohorts, not as a confirmed disease signature.
Merler et al. approached the ALS side of the problem from a different angle, using speech AI for clinical assessment and interpretation in a narrower ALS context.4 The MHD-relevant point is that speech AI may become clinically useful fastest where repeated monitoring matters: ALS progression, Parkinson’s dysarthria, post-stroke recovery, and remote rehabilitation follow-up.
What This Evidence Can and Cannot Support
Evidence-strength note: this is a preprint and a multi-corpus retrospective validation, not a prospective clinical trial. It can support a research claim that phonological subspace collapse tracks dysarthria severity across heterogeneous datasets. It cannot support diagnosis, treatment selection, disability determination, or replacement of clinical speech-language pathology assessment.
The strongest version of the finding is narrow but useful: a training-free, interpretable speech profile may identify severity-linked loss of speech-sound separation without needing labeled dysarthric speech for each language.
The weakest version would oversell it as a universal diagnostic test. Several barriers remain:
- Preprint status: the work has not been peer reviewed.
- Recording dependence: microphone, speech task, language, and token count affect absolute values.
- Alignment confounding: forced alignment degrades in severe speech, although the reported adjustment changed correlations by only 0.1% to 3.8%.
- Prosody gap: the current feature set focuses on segmental contrasts, while Parkinson’s disease and cerebellar disorders often involve pitch, loudness, rhythm, and stress-pattern changes.
- Disease-specific validation: ALS and stroke monitoring need larger longitudinal cohorts before progression claims are defensible.
A practical deployment pathway would start with standardized home or clinic recordings, local healthy-control calibration, repeated within-person tracking, and clinician-visible feature profiles. That is enough to make the tool useful for triage and monitoring research without pretending it is ready to diagnose dysarthria by itself.
Questions About Dysarthria Speech Biomarkers
Is this a diagnostic test for dysarthria?
No. The preprint frames the method as a research biomarker and screening/monitoring tool. Diagnosis still requires clinical assessment, medical context, and speech-language pathology judgment.
Why use d-prime instead of a single AI severity score?
D-prime can show which speech-sound contrasts are becoming less distinct. A single AI score may classify severity, but it often hides whether the signal came from nasality, voicing, vowel space, fricatives, or another subsystem.
Could this help ALS monitoring?
Possibly, but the current ALS evidence is too small. The preprint included 50 ALS speakers overall, but only 5 had severity-graded labels in the key disease-specific severity analysis. Longitudinal ALS cohorts are needed before the method can be treated as a progression marker.
Why is cross-site calibration such a problem?
D-prime depends on how much speech is recorded, what speech task is used, microphone quality, language-specific sound structure, and alignment quality. Values can rank severity inside a controlled setup before they can be treated as universal thresholds across clinics.
References
- Muller B, Ortiz Barranon AA, Roberts L. Training-Free Cross-Lingual Dysarthria Severity Assessment via Phonological Subspace Analysis in Self-Supervised Speech Representations. medRxiv. 2026. doi:10.64898/2026.04.12.26350731
- Kadirvelu B, Ganapathy S, Sinha S, et al. Severity-aware learning with triplet loss for dysarthric speech classification. PLOS Digital Health. 2025;4(11):e0001076. doi:10.1371/journal.pdig.0001076
- Troeger J, et al. An automatic measure for speech intelligibility in dysarthrias. Frontiers in Digital Health. 2024;6:1385813. doi:10.3389/fdgth.2024.1440986
- Merler M, et al. Clinical assessment and interpretation of dysarthria in ALS. npj Digital Medicine. 2025;8:45. doi:10.1038/s41746-025-01654-7
- Hsu WN, Bolte B, Tsai YHH, Lakhotia K, Salakhutdinov R, Mohamed A. HuBERT: Self-supervised speech representation learning by masked prediction of hidden units. IEEE/ACM Transactions on Audio, Speech, and Language Processing. 2021;29:3451–3460. doi:10.1109/TASLP.2021.3122291
- McAuliffe M, Socolof M, Mihuc S, Wagner M, Sonderegger M. Montreal Forced Aligner: trainable text-speech alignment using Kaldi. Proceedings of Interspeech. 2017:498–502. doi:10.21437/Interspeech.2017-1386