A 2,251-child national parent-report preprint found that the 7-item Parent-report Nationwide Quality of Life Scale had internal reliability of alpha = 0.85 and correlated most strongly with suicidality (r = -0.50), depression (r = -0.47), and internalizing symptoms (r = -0.43).1
Research Highlights
- Reliability was solid for a brief scale: the 7-item parent P-NQLS showed internal consistency of alpha = 0.85 in 2,251 children aged 6 to 18 years.1
- Lower quality of life tracked suicidality: P-NQLS total scores correlated with suicidality at r = -0.50, the strongest symptom association reported in the abstract.1
- Depression and internalizing also tracked lower scores: correlations were r = -0.47 for depression and r = -0.43 for internalizing symptoms, all p < .0001.1
- Scores declined with age: lower-percentile curves showed 3 to 5 point decreases across age, suggesting the lowest-quality-of-life group may diverge most during adolescence.1
- Preprint limits remain: the scale supports screening and monitoring, not diagnosis of depression, suicidality, ADHD, or behavior disorders.1
Quality of life in youth mental health means how a child is functioning and feeling across daily life: relationships, school, family participation, enjoyment, future outlook, and emotional burden. It overlaps with symptoms, but it is not identical to a depression or anxiety checklist.
Parent report is one informant channel. Parents see sleep, irritability, school avoidance, family functioning, and behavior at home. They may miss private internal distress, so parent report should complement youth self-report and clinician assessment rather than replace them.2
A 7-Item Parent Scale Carried a One-Factor Signal
Liu et al. developed the Parent-report Nationwide Quality of Life Scale (P-NQLS), collected a national U.S. parent sample of 2,251 children aged 6 to 18 years, and tested the scale’s structure, reliability, convergent validity, and age- and sex-specific norms.1
Exploratory factor analysis is a statistical method that asks whether item responses cluster into 1 or more underlying dimensions. The P-NQLS showed a one-factor solution, meaning the 7 items behaved like a single overall parent-reported quality-of-life construct.
The total score averaged 20.7 with an SD of 4.7 on a 0 to 28 scale, where higher scores indicated better quality of life. Internal consistency reached alpha = 0.85. Cronbach alpha estimates how strongly items move together; 0.85 is generally consistent with a scale that has enough coherence for group-level research and screening workflows.
Suicidality Had the Strongest Symptom Correlation
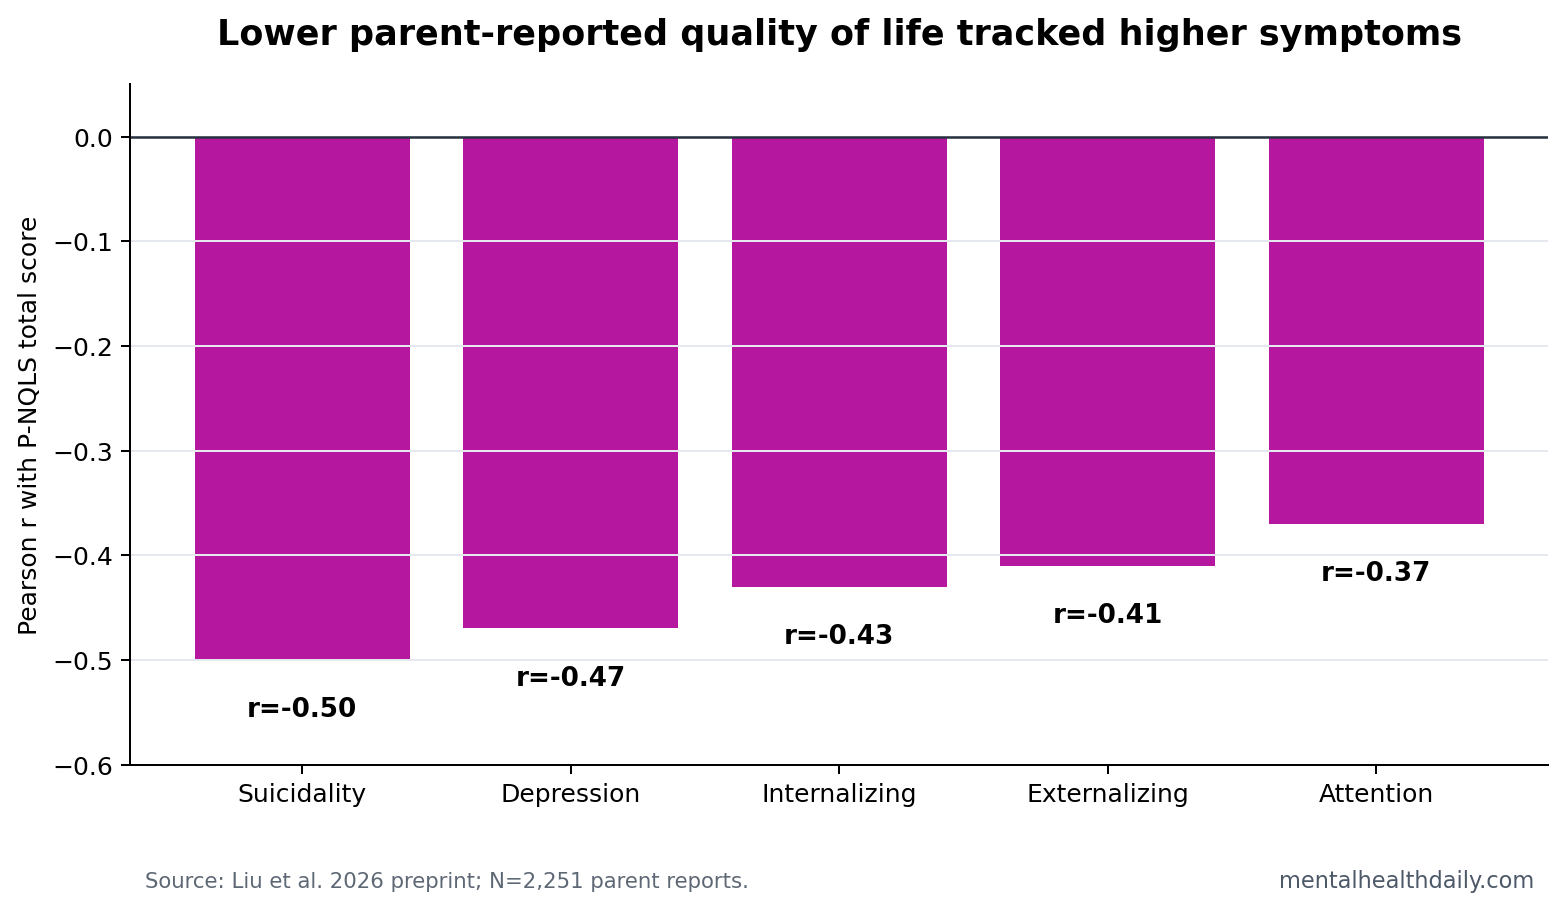
The most clinically sharp result was not that quality of life was “related to symptoms.” It was the pattern of correlations. P-NQLS scores were negatively correlated with suicidality at r = -0.50, depression at r = -0.47, internalizing at r = -0.43, externalizing at r = -0.41, and attention symptoms at r = -0.37.
Pearson correlation describes how strongly 2 continuous measures move together. Negative values here mean that higher symptom scores were associated with lower parent-reported quality of life. The numbers are not diagnostic thresholds, but they are too large to treat quality of life as a decorative add-on.
The operational use is triage. Suicidality and depression can be underdetected when clinicians rely only on broad functioning impressions. A low parent quality-of-life score should not diagnose suicidality, but it should increase urgency for direct suicide-risk and depression screening.
Age Norms Expose Who Is Falling Behind
The researchers modeled age- and sex-specific percentile curves from the 5th through 95th percentiles. Scores declined steadily with age in both sexes, and the biggest age-related drops appeared at the lower percentiles, around 3 to 5 points.
That percentile pattern is more useful than a single mean score. If a 16-year-old has a low score, the clinician should ask whether the score is low relative to same-age peers and whether the child is drifting farther from the normative curve over time.
Pediatric quality-of-life tools have long been used to capture daily functioning that symptom scales can miss.3,4 The P-NQLS adds a mental-health-focused parent-report option with national norms, which can help clinicians avoid treating “symptom improvement” as the only outcome that counts.
Parent Quality-of-Life Scores Are Screening Signals, Not Diagnoses
Evidence-strength note: this was a psychometric preprint. It supports reliability, one-factor structure, symptom correlations, and normative benchmarks. It does not show that the P-NQLS diagnoses suicidality, depression, ADHD, or externalizing disorders.
Parent-report scales also carry known blind spots. A child can hide suicidal thinking. A teen can look functional at home while deteriorating socially. A parent can overreport behavior problems during family conflict or underreport distress because the child is quiet.
The correct use is layered assessment: P-NQLS for quality-of-life signal, symptom scales for specific domains, direct youth self-report for internal states, and clinician follow-up when scores are low or changing quickly.
Quality-of-Life Scores Can Catch Partial Recovery
Symptom scales answer one question: how much depression, anxiety, attention difficulty, or disruptive behavior is present? Quality-of-life scales answer a different question: is the child living better? Those answers can diverge after treatment.
A teenager may report fewer depressive symptoms but still avoid school, friends, and activities. Another child may still have attention symptoms but function better because family routines, school accommodations, and sleep improved. A parent-reported quality-of-life scale can make those partial gains and residual impairments visible.
Monitoring role: repeated P-NQLS scores could help clinics notice when symptom improvement is not translating into daily-life recovery. That is especially relevant for children near the lower percentiles, where the 2026 preprint found larger age-related declines.
Referral role: a low score can point the visit toward practical domains: school refusal, peer isolation, family conflict, activity loss, sleep schedule, and safety concerns. Those domains often decide whether a youth is actually improving outside the rating-scale packet.
The scale’s brevity is part of the value. A 7-item parent tool is easier to repeat than a long battery, and repeatability is what makes change detection possible. The tradeoff is that a brief scale needs follow-up questions whenever the score is low, falling, or inconsistent with youth self-report.
Norms also help prevent overreading ordinary developmental change. Adolescence can bring lower parent-rated quality-of-life scores for many reasons: school demands, peer comparison, autonomy conflict, sleep shift, and emerging mood symptoms. Age-specific percentiles let clinicians ask whether a score is typical for age or unusually low.
The strongest safety use is discordance. A parent may rate quality of life as poor while the child minimizes distress, or a child may report suicidal thinking while the parent sees only irritability. Discordant reports are not noise to average away. They are clues about visibility, disclosure, family context, and immediate risk.
A practical workflow would treat low P-NQLS scores as a prompt for 3 follow-up checks: current suicidal ideation, school or peer functioning, and whether the youth’s own report agrees with the parent rating. A brief quality-of-life scale is most useful when it changes the next question the clinician asks.
The scale may also help in medication or therapy follow-up. If symptom scores improve but quality-of-life scores remain low, treatment may need to target sleep, family routines, accommodations, social withdrawal, or activity scheduling rather than only increasing symptom-focused care.
Discordance: that measurement gap is especially visible when families and clinicians disagree about progress. Symptom scores can improve because a child reports fewer depressive thoughts, while parent-observed quality of life remains low because school attendance, peer contact, sleep timing, and daily activity have not recovered.
The reverse can also happen: family routines and functioning improve before internal distress is fully disclosed. A parent P-NQLS score should therefore be read as a functioning signal that sits beside youth self-report, not above it.
Norms: benchmarked percentiles make that signal more usable than a raw total score alone. A total score of 20 may mean something different for a 6-year-old than for a 17-year-old, especially when the 2026 preprint found lower-percentile scores declining by 3 to 5 points with age.
The value is not a diagnostic cutoff. It is a fast way to decide whether the next clinical question should be about safety, school refusal, social withdrawal, family stress, or treatment response.
Multi-informant use: parent report is strongest when it is treated as one informant stream. Youth self-report is still needed for internal states that parents may not see, especially suicidal thinking, shame, substance use, and peer conflict. Teacher input can add a school-functioning view that neither parent nor child captures cleanly.
That is why the P-NQLS should not be used as a replacement for symptom scales. It adds a compact daily-life outcome: whether the child is functioning, participating, and recovering in ways that matter outside the clinic. A low score should widen the assessment, not close it.
Questions About Parent-Reported Youth Quality-of-Life Screening
Can a low P-NQLS score diagnose suicidality?
No. The correlation with suicidality was strong enough to justify follow-up screening, but diagnosis and risk assessment require direct clinical questioning and safety evaluation.
Why use a quality-of-life scale if symptom scales already exist?
Symptoms and life impact are related but different. A child may have fewer symptoms yet still struggle socially, academically, or at home.
What is the strongest practical use of the new norms?
Age-specific norms can flag children whose quality-of-life scores are unusually low for their age or worsening over repeated visits.
References
- Liu Y, Youngstrom EA, Nienaber EA, Fristad MA. Normative Benchmarks for the Parent-report Nationwide Quality of Life Scale (P-NQLS). medRxiv. 2026. doi:10.64898/2026.04.16.26350886
- De Los Reyes A, et al. The Validity of the Multi-Informant Approach to Assessing Child and Adolescent Mental Health. Psychological Bulletin. 2015. https://doi.org/10.1037/a0038491
- Ravens-Sieberer U, et al. The KIDSCREEN-52 quality of life measure for children and adolescents. Quality of Life Research. 2005. https://doi.org/10.1586/14737167.5.3.353
- Varni JW, Seid M, Kurtin PS. PedsQL 4.0: Reliability and validity of the Pediatric Quality of Life Inventory Version 4.0 Generic Core Scales. Medical Care. 2001. https://doi.org/10.1097/00005650-200108000-00006