
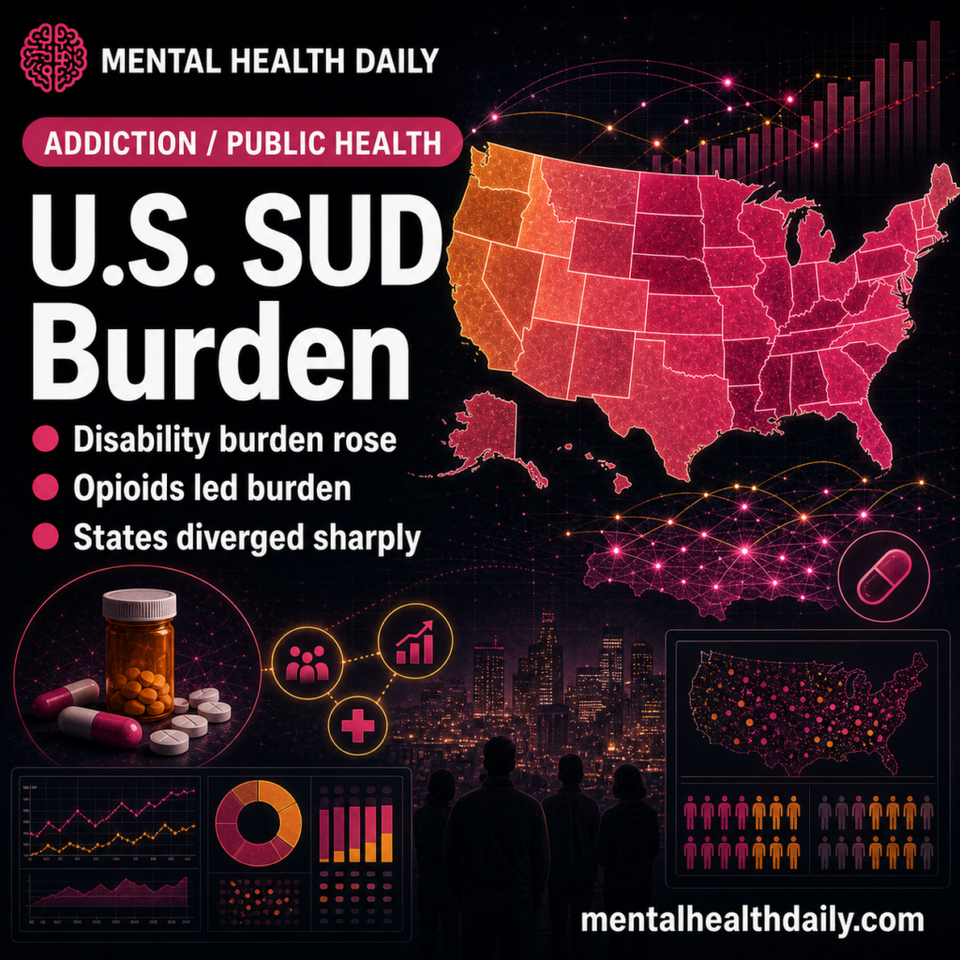
A Global Burden of Disease analysis estimated that U.S. age-standardized substance-use disorder disability-adjusted life-year rates rose 213.5% from 1990 to 2019, with opioid use disorders producing the steepest increase and the largest state-level burden.1
Research Highlights
- U.S. cases rose sharply: prevalent substance-use disorder cases increased from 12.6 million in 1990 to 19.5 million in 2019.1
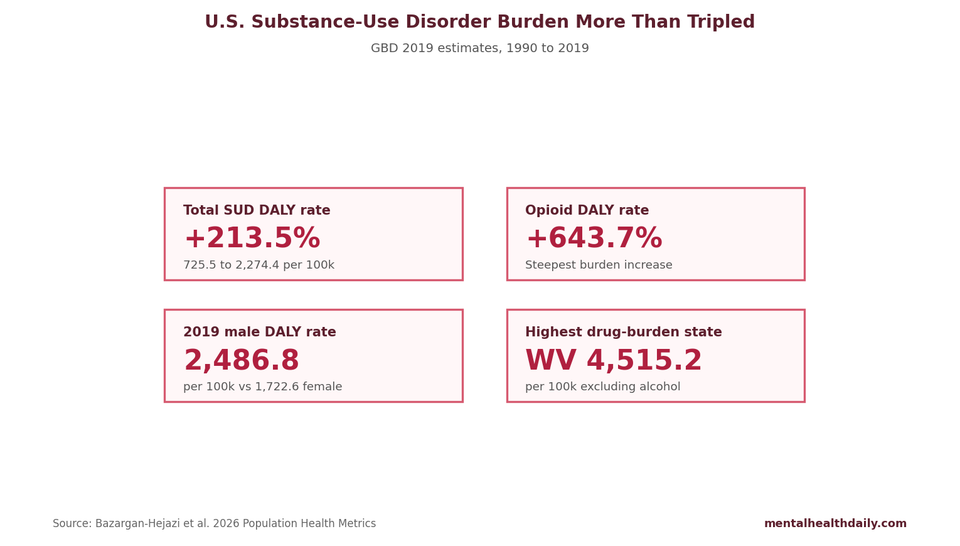
- DALY rates more than tripled: age-standardized substance-use disorder DALY rates rose from 725.5 to 2,274.4 per 100,000, a 213.5% increase.1
- Opioids dominated the change: opioid use disorder prevalence rose 618.5%, and opioid-related DALY rates rose 643.7%.1
- Male burden stayed higher: in 2019, male DALY rates were 2,486.8 per 100,000 compared with 1,722.6 per 100,000 in females.1
- State burden varied widely: West Virginia had the highest 2019 drug-use disorder DALY rate excluding alcohol, while Nebraska had the lowest.1
Disability-adjusted life-years, or DALYs, combine years lived with disability and years of life lost from premature death. In addiction epidemiology, DALYs help distinguish a condition with many nonfatal cases from a condition that also causes high mortality, overdose, infection, injury, or severe disability.
GBD 2019 Tracked Substance-Use Disorders Across 30 Years
Bazargan-Hejazi et al. analyzed U.S. substance-use disorder burden using the Global Burden of Disease 2019 framework. The analysis covered alcohol, opioid, cocaine, amphetamine, cannabis, and other drug use disorders from 1990 through 2019 across U.S. states.1
- Prevalence: the estimated number of people living with a substance-use disorder.
- DALY rate: the disability and mortality burden per 100,000 people after age standardization.
- Age standardization: a method that adjusts rates so population aging does not masquerade as disease change.
- State comparison: a way to expose geographic burden differences that national averages hide.
Global Burden of Disease modeling synthesizes surveillance data, vital statistics, claims, surveys, and statistical models. It is useful for population-level burden estimates, but it depends on data quality, diagnostic definitions, coding practices, and model assumptions.
Total SUD Burden Rose 213.5%, but Opioids Drove the Steepest Climb
Total burden: estimated prevalent substance-use disorder cases rose from 12.6 million to 19.5 million between 1990 and 2019. Age-standardized DALY rates rose from 725.5 to 2,274.4 per 100,000, a 213.5% increase.1
Opioid surge: opioid use disorder prevalence increased 618.5%, while opioid-related DALY rates rose 643.7%. Other drug use disorders also rose sharply, with prevalence up 129.5% and DALY rates up 438.9%. Cocaine-related DALY rates increased 142.0%, and amphetamine-related DALY rates increased 199.1%.
Alcohol and cannabis showed a different pattern. Alcohol use disorder prevalence rose 5.6%, and alcohol-related DALY rates rose 4.5%. Cannabis use disorder prevalence rose 16.8%, while age-standardized DALY rates were essentially unchanged in the analysis.1
Female Opioid Burden Rose Faster Than Male Opioid Burden
Male substance-use disorder DALY rates remained higher than female rates in 2019: 2,486.8 vs 1,722.6 per 100,000. The opioid trajectory, however, rose more steeply among females in relative terms.1
- Female opioid prevalence: 0.40 million in 1990 to 3.21 million in 2019, a 699.9% increase.
- Female opioid DALY rate: 149.9 to 1,231.6 per 100,000, a 721.5% increase.
- Male opioid prevalence: 0.49 million to 3.16 million, a 551.3% increase.
- Male opioid DALY rate: 259.6 to 1,808.2 per 100,000, a 596.5% increase.
Higher male burden and faster female relative growth can coexist. A group with lower baseline rates can show a larger percentage increase while still having a lower final rate than the comparison group.
State-Level Drug Burden Was Highest in West Virginia, Kentucky, and Ohio
Drug-burden map: in 2019, the highest drug-use disorder DALY rates excluding alcohol were estimated in West Virginia, Kentucky, and Ohio: 4,515.2, 3,560.7, and 3,140.4 per 100,000. The lowest rates were estimated in Nebraska, South Dakota, and North Dakota: 966.3, 1,030.6, and 1,062.3 per 100,000.1
Alcohol geography differed: the highest alcohol-use disorder DALY rates were in New Mexico, Alaska, and the District of Columbia: 729.1, 675.5, and 565.4 per 100,000. The lowest were in New Jersey, Maryland, and Texas: 272.9, 284.5, and 287.5 per 100,000.
State differences likely reflect drug supply, fentanyl penetration, prescribing history, treatment access, poverty, rurality, incarceration, infectious-disease risk, naloxone access, medication treatment availability, and mortality coding practices. GBD estimates describe burden; they do not identify which policy caused each state trajectory.
Adjacent Research Puts the Opioid Pattern in Context
Burden context: Degenhardt et al. estimated global alcohol and drug burden and showed that substance-specific disability and mortality vary sharply by drug class and region.2 U.S. opioid burden stands out because fatal overdose risk pushes DALYs upward beyond prevalence alone.
Diagnostic context: DSM-5 substance-use disorder criteria combine impaired control, social impairment, risky use, tolerance, withdrawal, and pharmacological features into a severity continuum.3 Population burden estimates depend on how those criteria map onto surveys, medical records, and mortality data.
Chronic disease management models for addiction emphasize long-term care rather than isolated detoxification, because relapse risk, psychiatric comorbidity, infectious disease, pain, housing instability, and criminal-legal exposure often persist after acute withdrawal ends.4
Evidence-Strength Note for This GBD Analysis
What the analysis supports: this descriptive epidemiology can quantify burden, compare substances, track long-term changes, and identify geographic differences. It is appropriate for planning treatment capacity, overdose prevention, medication access, harm reduction, and surveillance priorities.
Design limits: GBD modeling cannot prove that a specific law, prescribing practice, treatment program, or drug-market change caused the observed burden. Estimates also depend on available data, diagnostic coding, death-certificate accuracy, and model assumptions that may vary across states and years.
The analysis ended in 2019, before the full pandemic-era overdose surge. Current state-level burden may be higher or differently distributed after fentanyl expansion, disrupted treatment, economic stress, and shifts in polysubstance use.
Opioid DALY Growth Demands Low-Barrier Treatment Access
Opioid use disorder deserves the most urgent burden response because its DALY growth combines disability and premature mortality. High-burden states need low-friction access to buprenorphine and methadone, naloxone saturation, fentanyl test access, infectious-disease care, pain care alternatives, and treatment that survives homelessness, incarceration, transportation barriers, and psychiatric comorbidity.
Substance-specific planning: alcohol burden remains large despite slow relative growth, stimulant burden is rising, cannabis burden did not show the same DALY-rate escalation, and “other drug” categories can hide local changes in novel synthetic drugs. A national addiction plan built only around opioid headlines will miss several parts of the burden map.
Mortality-weighted urgency: DALYs rise when people live with disability and when people die early. Opioid use disorder does both at scale. That is why a state can have a modest prevalence increase and still face a steep burden increase if fentanyl, polysubstance exposure, untreated withdrawal, or overdose clusters push premature mortality upward.
Alcohol and stimulant programs should not be starved to fund opioid care, but the opioid curve explains why overdose prevention cannot sit outside mental-health planning. Emergency departments, psychiatric units, primary care offices, jails, shelters, and pain clinics all become addiction-care entry points when opioid burden is distributed across the same systems that see depression, trauma, chronic pain, and suicide risk.
Treatment Capacity Has to Match the Burden Map
The state spread in DALY rates argues for local capacity planning rather than a single national average. West Virginia's drug-use disorder burden excluding alcohol was more than 4 times Nebraska's 2019 estimate. A state with a high opioid DALY rate needs more than awareness messaging; it needs medication treatment slots, overdose reversal access, low-barrier intake, recovery housing, infectious-disease treatment, and continuity after jail, hospital, and emergency department encounters.
Operational implication: treatment reach should be measured against burden and patient access, beyond the number of clinics on a map. A county can technically have treatment available while still failing if wait times, transportation, insurance rules, stigma, or provider caps block entry.
Measurement implication: state planning should track more than overdose deaths. DALY burden should be paired with treatment initiation, treatment retention, medication access, nonfatal overdose, infectious-disease linkage, emergency-department recurrence, and county-level travel time. A state can reduce deaths while leaving disability high if patients survive overdoses but cannot enter continuous care.
- Opioid-heavy states: prioritize medications for opioid use disorder, naloxone, and fentanyl-era harm reduction.
- Alcohol-heavy states: expand screening, medication treatment, liver-disease linkage, and withdrawal-capable care.
- Stimulant-growth states: build contingency management access and psychiatric comorbidity care.
Questions About U.S. Substance-Use Disorder Burden
What does a DALY rate measure?
It combines disability and premature death into one population burden measure per 100,000 people.
Which substance drove the largest increase?
Opioid use disorders drove the steepest relative rise, with opioid-related DALY rates increasing 643.7% from 1990 to 2019.
Does this prove which policies worked?
No. The analysis describes burden patterns. Policy effects require designs that directly compare policy timing, exposure, implementation, and outcomes.
References
- The changing landscape of substance use disorders over 30 years: insights on US state disparities and policy from the global burden of disease study. Bazargan-Hejazi S, Ahmadi A, Lin J, et al. Population Health Metrics. 2026;24:14. doi:10.1186/s12963-026-00476-3
- The global burden of disease attributable to alcohol and drug use in 195 countries and territories, 1990–2016: a systematic analysis for the Global Burden of Disease Study 2016. Degenhardt L, Charlson F, Ferrari A, et al. Lancet Psychiatry. 2018;5:987–1012. doi:10.1016/s2215-0366(18)30337-7
- DSM-5 criteria for substance use disorders: recommendations and rationale. Hasin DS, O'Brien CP, Auriacombe M, et al. American Journal of Psychiatry. 2013;170:834–851. doi:10.1176/appi.ajp.2013.12060782
- Challenges applying chronic disease care models to addiction. Saitz R, Larson MJ, LaBelle C, Richardson J, Samet JH. Journal of Addiction Medicine. 2008;2:219–226. doi:10.1097/adm.0b013e318166af74