The honest answer to “is addiction getting worse” depends on which country and which substance. Yu and colleagues’ 2026 analysis in Journal of Global Health pulled Global Burden of Disease (GBD) 2021 estimates for alcohol use disorder (AUD) and drug use disorders (DUDs) across 204 countries from 1990 through 2021.1
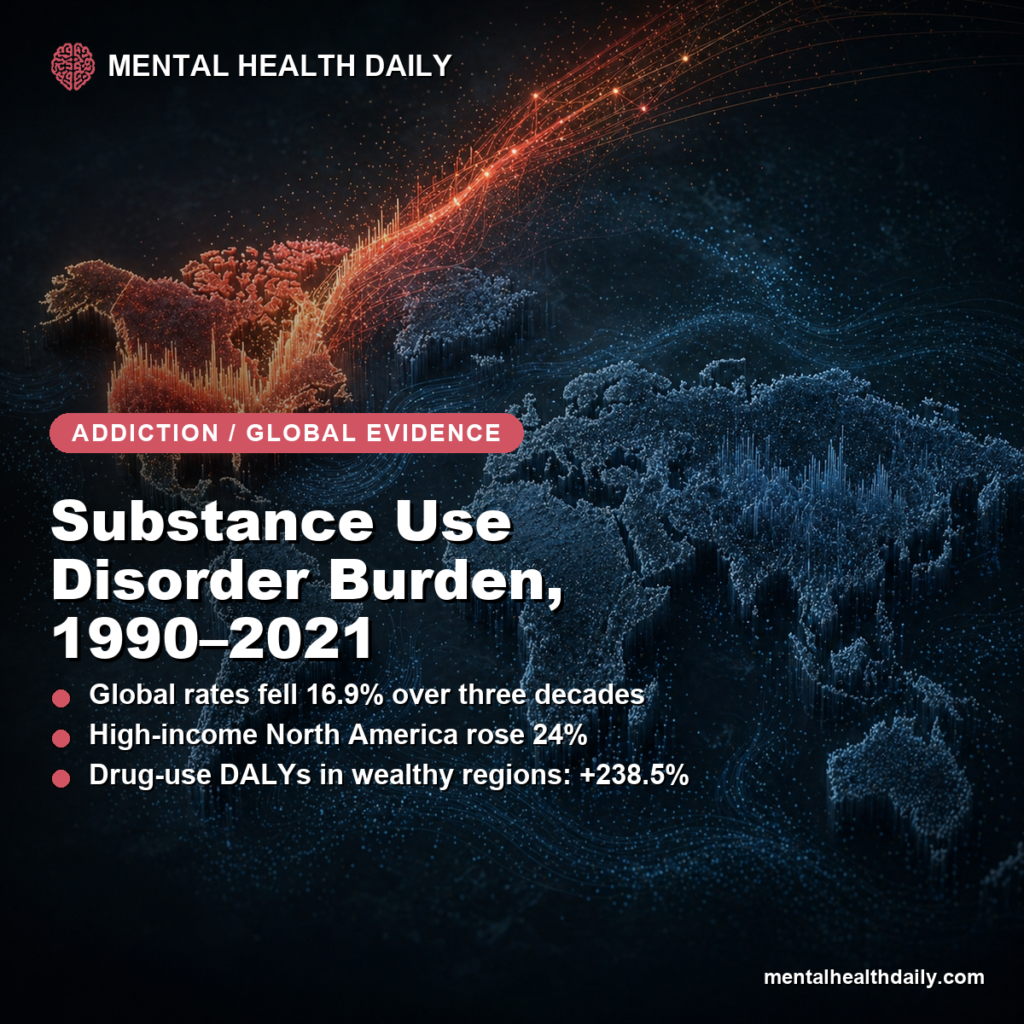
The headline US coverage skipped: globally, age-standardized SUD rates fell about 17%. The headline it centered: in high-income North America, rates rose 24%, and the drug-related share spiked again during the pandemic. Both are true; the interesting question is why they diverge.
Research Highlights
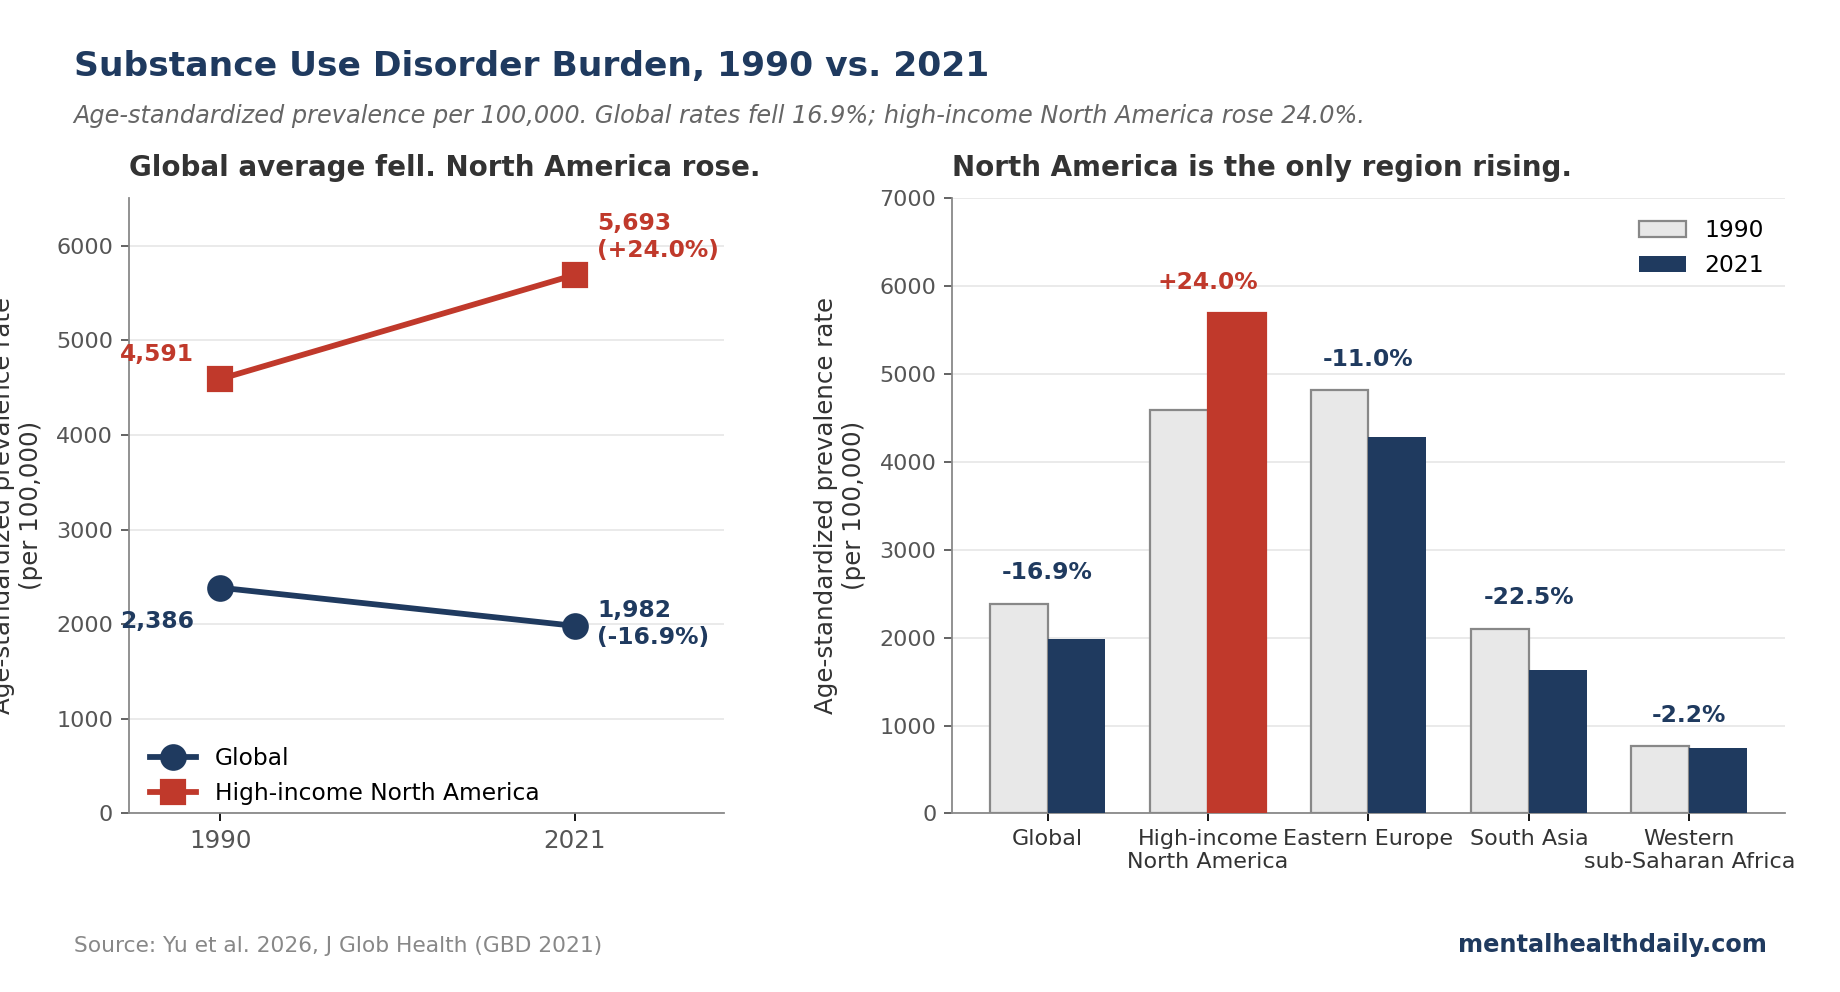
- Globally, age-standardized SUD rates fell 16.9% between 1990 and 2021. The 2026 Yu analysis of GBD 2021 data across 204 countries shows prevalence dropped from 2,386 to 1,982 cases per 100,000.1 The “addiction is exploding everywhere” framing isn’t supported by the global numbers.
- High-income North America moved the opposite direction. Age-standardized SUD prevalence there rose 24.0% over the same period and now sits around 5,693 per 100,000 — roughly 3 times the global average.1
- Drug use disorders rose sharply in high-development settings. In high-SDI (wealthier) regions, drug-use DALYs (disability-adjusted life-years, the GBD measure of healthy life lost) climbed 238.5% since 1990. The DALY rate fell or stayed flat almost everywhere else.1
- The post-COVID inflection is concentrated in wealthy countries. Drug-use-disorder burden rose in several high-SDI locations during 2020–2021. Yu’s design can’t formally attribute the inflection to the pandemic, but the timing fits CDC US overdose-mortality data.1,5
- Both stories are correct at once. “Addiction is getting worse” is right for the US drug-overdose era; it’s wrong as a global generalization. Alcohol burden is falling in most regions, including the US. The crisis is region- and substance-specific.
Global Age-Standardized SUD Burden Fell 16.9% Between 1990 and 2021
Yu and colleagues analyzed GBD 2021 estimates from the Institute for Health Metrics and Evaluation for 204 countries.1 They report age-standardized rates (ASRs — rates adjusted so countries with different age structures can be compared on equal footing) for prevalence, incidence, and DALYs (disability-adjusted life-years — the GBD measure of healthy life lost to disease).
In 2021, around 162.86 million people worldwide met criteria for a substance use disorder — 111.12 million with alcohol use disorder and 53.11 million with a drug use disorder. The global age-standardized prevalence rate (ASPR) was 1,982 per 100,000, down 16.9% from 2,386 in 1990. Age-standardized incidence fell 17.3%; the DALY rate (ASDR) fell 9.1%.
Alcohol drove most of the improvement. AUD prevalence dropped 21.3%, incidence 19.3%, DALYs 23.9%. Drug-use prevalence dropped less (−6.4%), and the DALY rate for drugs went the other way: +14.7% globally. Most of that increase concentrates in a few high-development regions, with the rest of the world stable or declining.1
This matches the longer arc described by Degenhardt and colleagues in their 2018 Lancet Psychiatry synthesis: alcohol-related burden has been moving down across most regions since the 1990s, even as the US opioid story dominated headlines.2 The GBD 2016 alcohol collaborators reached the same conclusion.3
High-Income North America: Highest Burden Globally and Rising Post-COVID
Region-level numbers tell a different story. High-income North America (the US and Canada in GBD’s grouping) recorded the highest age-standardized SUD prevalence in the world in 2021 at 5,693 per 100,000.1 Eastern Europe came second at 4,287; Australasia third at 3,837. Western sub-Saharan Africa sat at the other end at 747 — roughly a 7- to 8-fold gap, before adjusting for under-ascertainment in low-resource settings.
Since 1990, only two regions saw rising SUD prevalence: high-income North America (+24.0%) and Oceania (+2.4%). Every other region declined.
Drug-use burden is where the divergence is sharpest. The age-standardized DALY rate for drug use disorders in high-income North America rose 421.5% between 1990 and 2021. East Asia, by contrast, saw a 56.3% drop. The US recorded a drug-use-disorder prevalence of 3,821 per 100,000 in 2021 and a DALY rate over 1,900 per 100,000 — the most pronounced country-level outlier in the dataset.1
Yu’s analysis flags a temporal inflection in 2020–2021: drug-use-disorder burden rose in several high-SDI settings during the COVID period. The authors note they can’t formally pin this on the pandemic without an interrupted-time-series design. But the timing aligns with CDC NCHS data showing US drug overdose deaths climbed from about 70,000 in 2019 to over 100,000 in 2021, driven by illicitly manufactured fentanyl and its analogs.5
Why Global Addiction Trends and U.S. Trends Diverge
Yu and colleagues stratify by Socio-demographic Index (SDI — a composite of income per capita, schooling, and fertility that GBD uses to rank countries by development level). The SDI gradient is the most useful frame for the divergence.
For alcohol, prevalence declined across every SDI tier; the largest drops were in high-middle SDI countries. For drugs, the gradient runs the opposite way. In high-SDI regions, drug-use-disorder prevalence rose 47.9%, incidence 62.6%, and DALYs 238.5%. In middle and high-middle SDI tiers, the same metrics fell; in low-SDI settings they were broadly stable. The country-level correlation between SDI and drug-use-disorder prevalence is 0.83 — one of the strongest development gradients in the GBD dataset.1
Three plausible drivers, drawing on the trigger paper and Volkow and Blanco’s 2023 update in World Psychiatry:4
- Supply-side shift. Synthetic opioids (fentanyl, nitazenes) and stimulants (methamphetamine, cocaine) are far more lethal per dose than the drugs they displaced. The same number of users produces more overdose deaths and more disability when the supply is more potent. US overdose mortality more than tripled between 2010 and 2021, with synthetic opioids accounting for most of the increase.5
- Service disruption during COVID. In-person methadone and buprenorphine programs, syringe-service programs, and crisis services were partially suspended in 2020. Volkow’s 2023 review documents reduced treatment access alongside rising drug use during lockdowns.4
- Disposable income and access. Higher-development settings have more money to spend on drugs and more pharmaceutical infrastructure to divert. The strong SDI gradient for drugs — weak for alcohol, where access is closer to universal — points to availability and purchasing power as live mechanisms.
Alcohol runs the opposite way at the high end. Past a certain SDI threshold, AUD rates fall — the inverted-U pattern Yu’s data show clearly. Tighter regulation, higher taxes, declining youth drinking, and substitution toward cannabis in some cohorts plausibly contribute.
Burden Peaks in Young Adult Males
SUD prevalence peaks at age 25–29 in Yu’s analysis (males 5,108 per 100,000 vs. females 2,369), with incidence peaking at 30–34 in males.1 Drug use disorders peak earlier than alcohol: prevalence at 20–24 and incidence at 15–19 in males. AUD peaks at 40–44 for prevalence and 45–49 for DALYs.
Males have higher rates than females across nearly every age and substance, with male prevalence running roughly twice female in young-to-middle adulthood. Yu and colleagues note this likely reflects differential exposure, gendered care-seeking patterns, and shared genetic liability from twin and GWAS work.4
The young-adult concentration matters for prevention: most SUD onset happens before age 30. Hammond and colleagues argue that middle- and high-school prevention windows are where the leverage is, particularly for cannabis and stimulants where adolescent initiation is the strongest predictor of adult disorder.6
Limitations of the Yu GBD Analysis
Under-ascertainment in low-resource settings. SUD diagnosis depends on healthcare contact and clinician training. Countries with thin mental-health workforces — common across low- and middle-income regions per the WHO Mental Health Atlas — miss cases.7 Low burden estimates in West Africa and South Asia are partly genuine (lower exposure) and partly artifactual. Yu’s authors flag that country contrasts in DUDs should be read as descriptive patterns, not definitive rankings.
No causal attribution to COVID. The 2020–2021 inflection in DUDs burden in high-SDI settings is consistent with pandemic-related service disruption, but Yu’s design is descriptive. An interrupted-time-series analysis with policy and supply covariates would be needed to test pandemic effects. CDC overdose-mortality data give independent evidence the post-2020 acceleration is genuine in the US.5
Reliance on modeled estimates. GBD uses Bayesian meta-regression (DisMod-MR) to interpolate where survey data are sparse. For drug use disorders especially, inputs come from a patchwork of surveys, treatment registries, and mortality records of varying quality. Uncertainty intervals around country estimates are wide.
Stigma and criminalization shape disclosure. Where drug use carries severe criminal penalties, prevalence is undercounted — cutting toward underestimated burden in restrictive regimes.
The post-COVID window has a short tail. Yu’s data run through 2021. Provisional 2023 and 2024 CDC data suggest US overdose deaths peaked in late 2023 and declined through 2024.5 Whether the high-income-North-America rise continues, plateaus, or reverses isn’t answerable from this dataset.
What the Divergence Means in Practice
- “Addiction is exploding everywhere” doesn’t fit the data. Globally, age-standardized SUD rates have declined since 1990, with alcohol leading the improvement. Total case counts rose (162.86 million in 2021 vs. 122.99 million in 1990) because adult populations grew — per-capita risk has fallen.
- The US drug crisis is genuine and outsized. High-income North America has the highest absolute SUD burden globally and the steepest rise. A 421.5% increase in drug-use DALYs since 1990 is the most pronounced regional inflection in the GBD dataset.1
- Different settings need different responses. High-SDI countries with rising drug-use burden need expanded harm reduction (naloxone, supervised consumption, drug-checking) and low-threshold buprenorphine and methadone access. Middle-SDI countries benefit most from prevention infrastructure and screening in primary care. Low-SDI settings face a basic surveillance and treatment-capacity gap.4,7
- Alcohol still kills more people globally than illicit drugs. AUD accounts for roughly two-thirds of SUD prevalence and a large share of DALYs across most regions. US news centers drugs; globally, alcohol remains the larger source of substance-related health loss.3
- Watch the post-2021 trajectory. Yu’s data end before the most recent shifts in US drug supply (xylazine adulteration, fentanyl-stimulant co-use) and before provisional CDC data showing a 2024 decline in overdose deaths. The next GBD release will tell whether the high-income-North-America inflection has continued or bent.
FAQ: Global Addiction Trends
Is addiction getting worse globally?
Per-capita rates have fallen. Age-standardized SUD prevalence dropped 16.9% globally between 1990 and 2021. Total case counts rose because adult populations grew, but the average person’s risk of developing an SUD is lower now than 30 years ago in most regions.1
Why does the US look so different from the global trend?
High-income North America’s SUD prevalence rose 24.0% over the same period, driven almost entirely by drug-use disorders. The age-standardized DALY rate for drugs there climbed 421.5% — the steepest regional increase in the dataset. Synthetic opioids in the supply, service disruption during COVID, and high disposable income all plausibly contributed.1,4
Is the opioid crisis still getting worse?
Yu’s data end in 2021. Provisional CDC data show US drug overdose deaths peaked in late 2023 and declined notably through 2024.5 Whether the regional rise in Yu’s analysis has continued past 2021 is an open question pending the next GBD release.
Did COVID make substance use worse?
In high-development settings, yes — for drug-use disorders specifically. Yu’s analysis flags a 2020–2021 inflection in high-SDI regions, consistent with pandemic service disruptions and a more lethal drug supply. US overdose-mortality data tell the same story.1,5
Which substance causes the most harm globally?
Alcohol. It accounts for about 68% of SUD prevalence (111.12 million of 162.86 million cases) and is the dominant source of substance-related DALYs across most regions outside high-income North America.1,3
Are men or women more affected?
Men, by a wide margin. Male SUD prevalence is roughly twice female prevalence at the peak ages (25–35), reflecting differential exposure, gendered care-seeking, and shared genetic liability.1,4
Where is substance-use burden lowest?
North Africa and the Middle East (around 802 per 100,000) and Western sub-Saharan Africa (747 per 100,000) report the lowest rates.1 Some of the gap is genuine (lower exposure, including religious-cultural restrictions on alcohol); some reflects under-ascertainment in settings with thin mental-health surveillance.7
References
- Global substance use disorders burden from 1990 to 2021: post-COVID shifts and widening inequalities. Yu T, Wang M, Zheng J, Guan S, Chen J. Journal of Global Health. 2026;16:04131. doi:10.7189/jogh.16.04131
- The global burden of disease attributable to alcohol and drug use in 195 countries and territories, 1990–2016: a systematic analysis for the Global Burden of Disease Study 2016. Degenhardt L, Charlson F, Ferrari A, et al. The Lancet Psychiatry. 2018;5(12):987-1012. doi:10.1016/S2215-0366(18)30337-7
- Alcohol use and burden for 195 countries and territories, 1990–2016: a systematic analysis for the Global Burden of Disease Study 2016. GBD 2016 Alcohol Collaborators. The Lancet. 2018;392(10152):1015-1035. doi:10.1016/S0140-6736(18)31310-2
- Substance use disorders: a comprehensive update of classification, epidemiology, neurobiology, clinical aspects, treatment and prevention. Volkow ND, Blanco C. World Psychiatry. 2023;22(2):203-229. doi:10.1002/wps.21073
- Drug overdose deaths in the United States, 2002–2022. Spencer MR, Garnett MF, Miniño AM. NCHS Data Brief, no 491. Hyattsville, MD: National Center for Health Statistics; 2024. doi:10.15620/cdc:135849
- Substance use treatment recommendations for youth with co-occurring substance use and mental health disorders. Hammond CJ, Parhami I, Young AS, et al. Child and Adolescent Psychiatric Clinics of North America. 2023;32(4):775-797. doi:10.1016/j.chc.2023.05.004
- Mental Health Atlas 2020. World Health Organization. Geneva: World Health Organization; 2021. WHO Mental Health Atlas 2020