
The structural determinants of mental health get less air time than individual treatments, but a 2025 CDC analysis of 3,121 US counties from Bolduc et al. shows just how much county-level economics moves population mental health: a model built from 11 economic variables explains roughly 70% of the variation in adult poor-mental-health prevalence across the country in 2019.1
Research Highlights
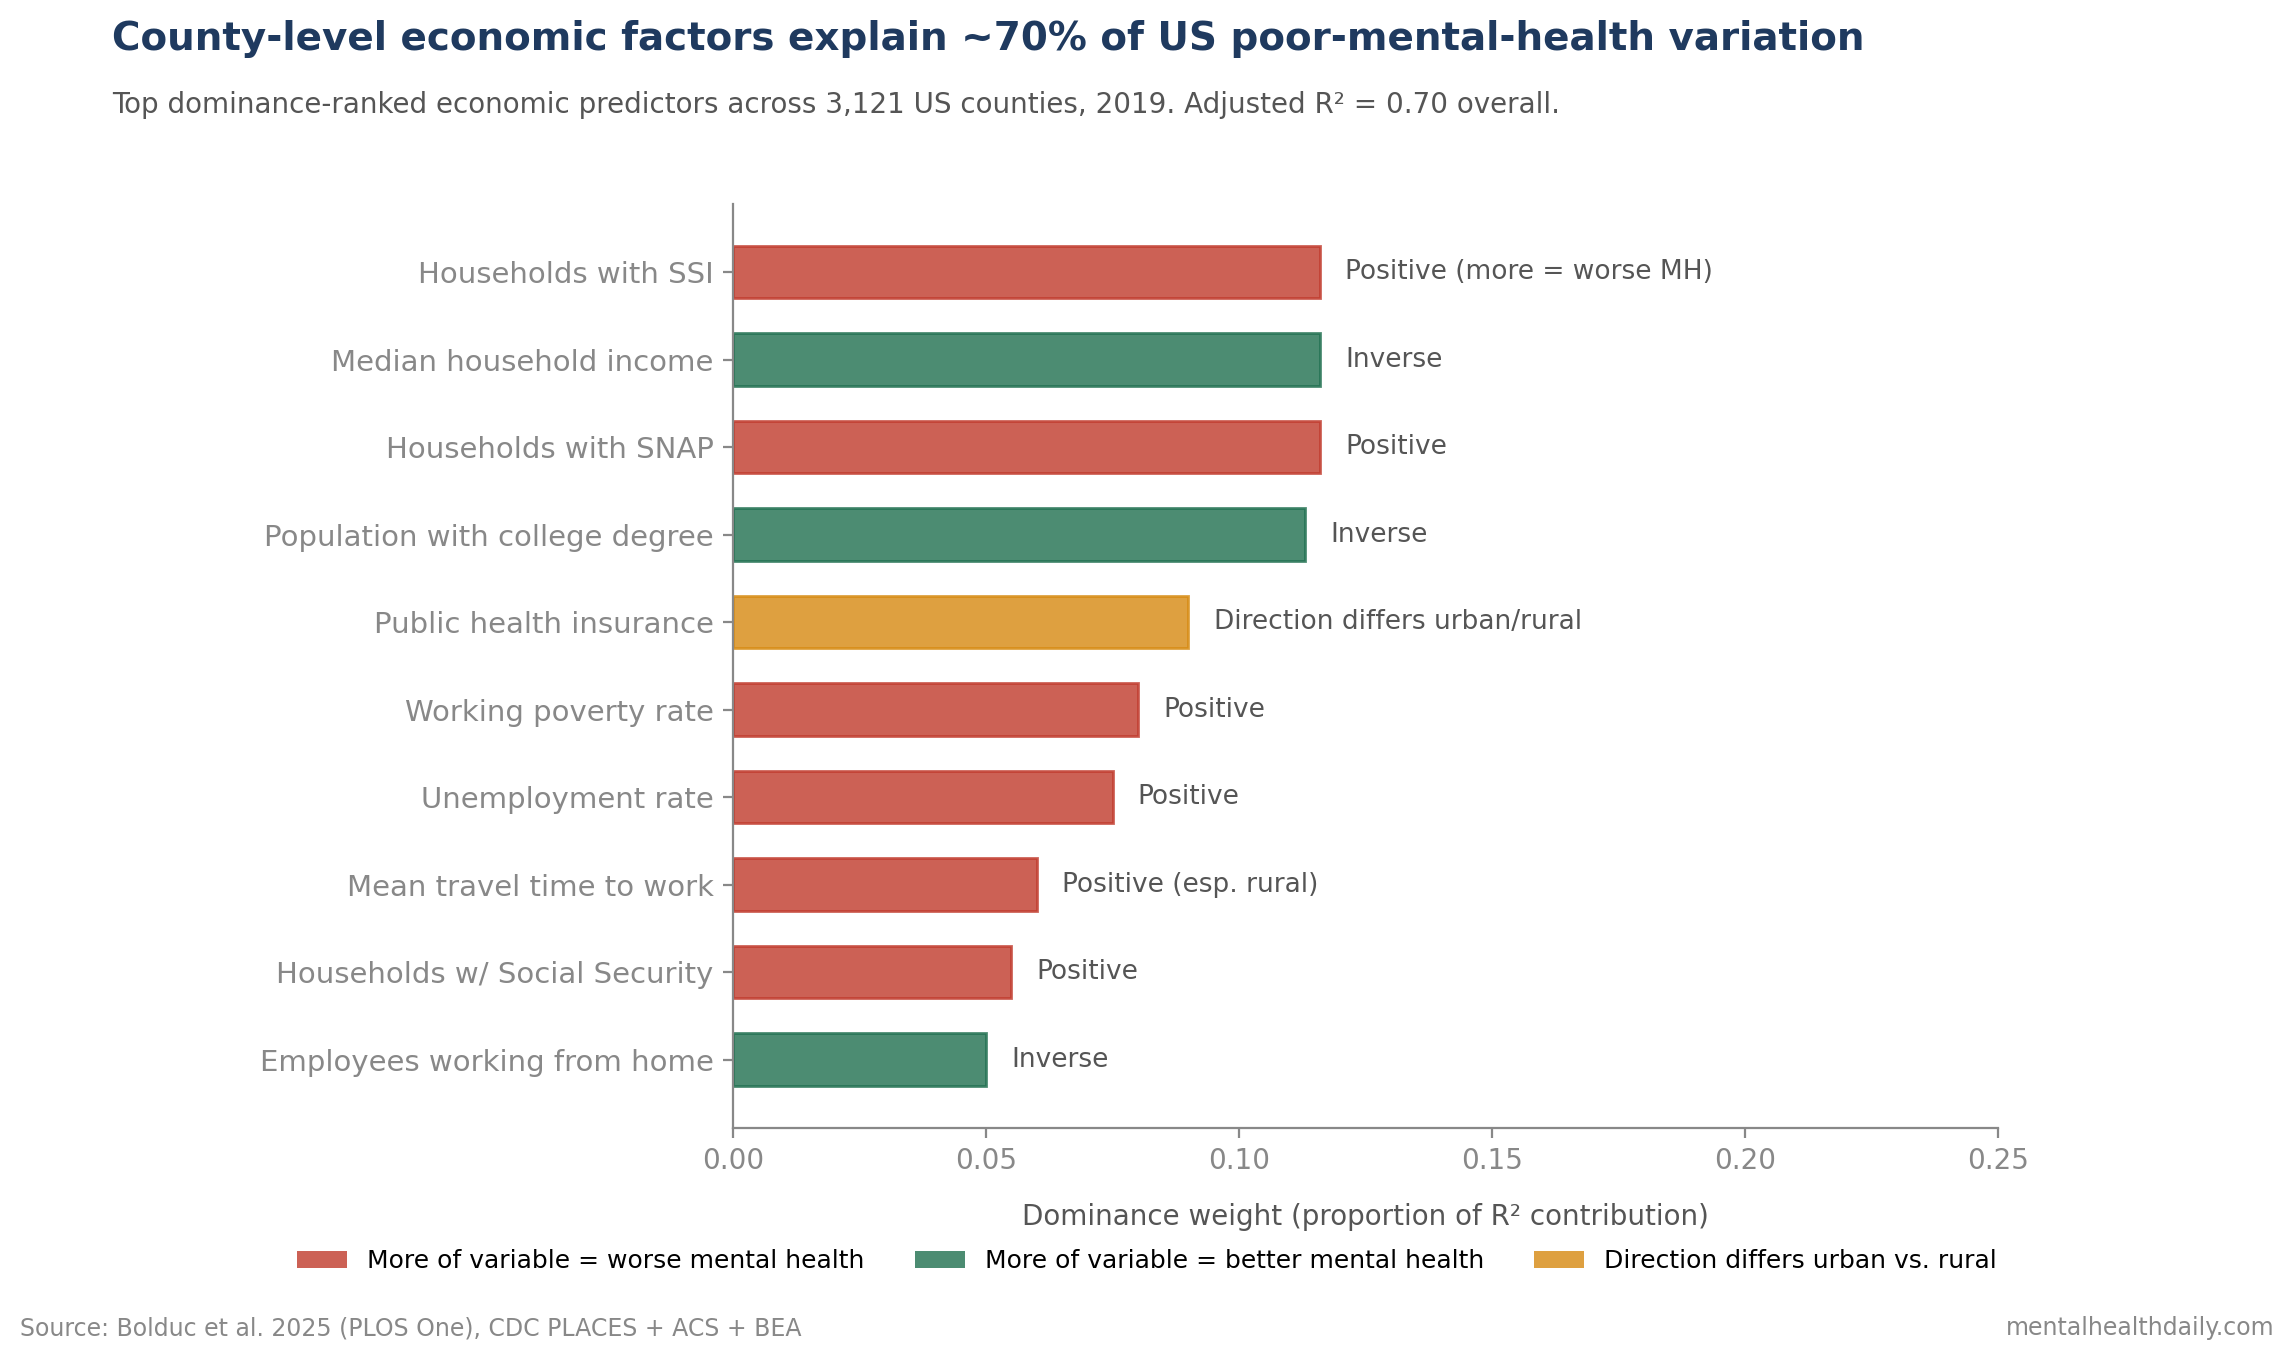
- Adjusted R² = 0.70 for the overall model and 0.69 for the urban and rural models — meaning measurable economic factors account for about 70% of the variation in poor-mental-health prevalence between counties.1
- Top dominance-ranked predictors: percent of households receiving Supplemental Security Income (SSI), median household income, percent receiving Supplemental Nutrition Assistance Program (SNAP) benefits, percent of the population with a college degree, and percent with public health insurance.1
- Positively associated with poor mental health: unemployment, working poverty rate, mean travel time to work, Social Security receipt, SSI receipt, and SNAP receipt — all markers of economic precarity.1
- Inversely associated with poor mental health: employees working from home, median household income, and percent with a college degree — markers of economic resilience and educational opportunity.1
- Geographic clustering: highest poor-mental-health prevalence in Appalachia, the Deep South, parts of Alaska, Montana, South Dakota, and the Southwest; lowest in the Upper Midwest. County range: 9.7% (Falls Church, VA) to 26.3% (East Carroll Parish, LA).1
The “poor mental health” outcome in this study comes from the BRFSS question asking how many of the past 30 days the respondent’s mental health was not good. A response of 14 or more days defines poor mental health. CDC PLACES generates county-level prevalence estimates by combining BRFSS responses with American Community Survey data through a multilevel model.1
Mean county prevalence was 16.0%, with an interquartile range of 14.1–17.8%. The variation between counties is substantial — nearly 3-fold between best and worst.
The Bolduc team’s question was structural: what county-level economic patterns explain that variation, and do urban and rural counties show the same drivers?
Bolduc 2025: 3,121 Counties, Pre-COVID Baseline, Dominance Analysis
The analysis used 2019 data deliberately to capture economic structure before the COVID-19 pandemic disrupted both economic conditions and mental health prevalence.1
The dataset combined:
- CDC PLACES for the dependent variable: county-level prevalence of poor mental health (BRFSS-derived).
- US Bureau of Economic Analysis for GDP, GDP change, and related business measures.
- American Community Survey 5-year estimates for income, employment, education, housing affordability, insurance coverage, and demographic variables.
- County Health Rankings for primary care and mental health provider density.
The dominance analysis is the methodological centerpiece. Rather than running a single regression and reading coefficients, dominance analysis ranks variables by their average contribution to R² across all possible subsets of regression models. The result is a more interpretable measure of relative importance when predictors are correlated.
Variable selection used scree plots to identify the most influential variables: 11 retained for the overall model, 7 for urban counties, 8 for rural counties.
The retained variables were then assessed for statistical significance through multiple linear regression with county-level poor mental health as the outcome.
Income, Education, and Safety-Net Use Were the Top Predictors
The top dominance-ranked predictors across all 3,121 counties were:1
- Percent of households with SSI receipt. Supplemental Security Income provides cash assistance for low-income people who are blind, disabled, or 65+. Higher county SSI receipt strongly tracks with higher county poor-mental-health prevalence.
- Median household income. Inverse association — higher county median income, lower poor mental health.
- Percent receiving SNAP benefits. Higher SNAP receipt tracks with higher poor mental health, reflecting food insecurity as both a marker and a driver of distress.
- Percent of population with a college degree. Inverse association — more educated counties have lower poor mental health.
- Percent with public health insurance. Mixed direction by urban-rural split (see below).
The signs of these associations are not surprising on their own. The novel piece is the magnitude: 70% of variation between counties is explainable from these structural variables alone, before any individual-level mental-health factors enter the picture.
Urban and Rural Counties Show Different Economic Drivers
The same overall pattern held when counties were stratified by USDA Rural-Urban Continuum Codes, but with notable specifics.
Urban counties: SSI, median household income, college degree, and SNAP remained top predictors. Public health insurance was positively associated with poor mental health — counties with more public insurance enrollment had higher poor-mental-health prevalence.1
Rural counties: SSI, median income, SNAP, and college degree remained top, but mean travel time to work emerged as a higher-ranked predictor than public insurance. Long commutes flag rural geographic isolation and the structural difficulty of accessing services.1
The most striking urban-rural difference: public health insurance was positively associated with poor mental health in urban counties (more public insurance = more poor mental health) and inversely associated in rural counties (more public insurance = less poor mental health).
The likely explanation is selection. In urban areas, public insurance enrollment correlates strongly with poverty and other distress markers, so the public-insurance-poor-mental-health link reflects underlying disadvantage. In rural areas, where private insurance is less available, public insurance acts more as broad coverage and has different population correlates.
The pattern is a reminder that the same economic variable can have opposite policy implications depending on the setting.
Specific Variable Direction in the Multivariable Model
In the overall multivariable regression with the 11 retained variables:
Positively associated with poor mental health (each higher value means higher poor-MH prevalence):
- Unemployment rate.
- Working poverty rate (employed but below the federal poverty level).
- Mean travel time to work.
- Households with Social Security receipt.
- Households with SSI receipt.
- Households with SNAP benefits.
Inversely associated with poor mental health (each higher value means lower poor-MH prevalence):
- Employees working from home.
- Median household income.
- Percent of population with a college degree.
The largest coefficients were in the overall model for working-from-home, median household income, and college degree. The interpretation is that economic resilience — flexibility in employment, income above precarity, educational attainment — flags lower population-level distress.
County Mental Health Planning Should Track SSI, SNAP, Income, and Degree Mix
- Mental health is a structural problem at the population level. 70% of between-county variation in poor mental health is explained by economic factors alone. Individual treatment matters but cannot do the job structural intervention is needed for.
- Income, education, and food security are leverage points. The strongest economic predictors point to interventions that already exist as policy levers: living-wage policies, college affordability, SNAP eligibility expansion, paid family and sick leave.
- Long commute time matters in rural counties. The mean-travel-time signal in rural areas places transportation infrastructure and remote-work access in the mental-health policy conversation alongside their conventional economic policy framing.
- Urban-rural divides need separate frameworks. The opposite signs on public insurance between settings illustrate that one-size-fits-all economic policies will produce different mental health effects in different geographies.
- Causality is not established. Cross-sectional ecological designs cannot prove that changing economic factors would reduce poor mental health. The pattern is consistent with bidirectional relationships and shared upstream causes.
County-Level Economics Cannot Explain Individual Mental Health Risk
It is ecological and cross-sectional. The analysis is at the county level, not the individual level. Drawing individual-level conclusions from county-level associations risks the ecological fallacy.
Causal direction is not testable. Higher SSI receipt may flag more economic distress, which causes more mental health problems. It may also flag more access to disability benefits among people whose mental health limits work. The cross-sectional design cannot separate these.
The outcome is self-reported. “Poor mental health days” on BRFSS is a subjective, single-item measure that captures stress, depression, and emotional problems without distinguishing between them. Diagnostic-grade mental-health prevalence requires clinical assessment.
2019 baseline doesn’t capture pandemic shifts. Both the economic and mental health landscapes have changed substantially since 2019. The structural relationships likely persist, but specific magnitudes may differ post-COVID.
The model explains variation between counties, not within counties. Two counties with similar economic profiles can have different mental health prevalences for reasons (cultural factors, healthcare quality, environmental exposures) the model doesn’t capture.
Questions About Economic Factors and Population Mental Health
How much of mental health is economic vs. individual?
At the county-level population scale, economic factors explained roughly 70% of the variation in poor-mental-health prevalence between counties.1
The variance explained refers to between-county prevalence differences, not to individual-level mental health. Population-level prevalence between geographic areas is largely explainable from structural economic factors; individual mental health depends on many additional clinical and personal variables.
Would raising the minimum wage reduce mental health problems?
The Bolduc data show working poverty (employed but below federal poverty level) is positively associated with poor mental health.1
This is consistent with but does not directly test the hypothesis that minimum-wage policy reduces mental health problems. Quasi-experimental studies of state minimum wage changes have shown mental-health benefits in some analyses but not others.
Why is SSI receipt the strongest predictor?
SSI is a means-tested cash benefit for blind, disabled, and elderly low-income individuals. Higher county SSI rates flag a combination of poverty and disability concentration, both of which independently predict mental health problems.1
The variable serves as a strong composite marker of structural economic distress at the county level.
Why does public insurance go in opposite directions for urban vs. rural?
In urban counties, public insurance enrollment correlates with poverty and other distress markers, so higher public-insurance counties have higher poor-mental-health prevalence.1
In rural counties, where private insurance options are scarcer, public insurance enrollment reflects broader population coverage and tracks with better mental health outcomes — it functions as access to care rather than as a poverty marker.
What can clinicians do with this information?
Three things. First, recognize that patients in economically distressed counties are operating against a structural headwind that individual treatment alone cannot solve. Second, screen for and address concrete economic stressors (food insecurity, housing instability, financial pressure) as part of routine care. Third, support advocacy for population-level policies (minimum wage, SNAP expansion, mental health parity, transportation access) that affect mental health far beyond what any clinic can produce alone.1
References
- Economic factors associated with county-level mental health – United States, 2019. Bolduc MLF et al. PLOS One. 2025;20(6):e0300939. doi:10.1371/journal.pone.0300939
- Mental Health Surveillance Among Children — United States, 2013-2019. Bitsko RH et al. MMWR Supplements. 2022;71(2):1-42. doi:10.15585/mmwr.su7102a1
- Income inequality and depression: a systematic review and meta-analysis of the association and a scoping review of mechanisms. Patel V et al. World Psychiatry. 2018;17(1):76-89. doi:10.1002/wps.20492
- The economic burden of adults with major depressive disorder in the United States (2010 and 2018). Greenberg PE et al. PharmacoEconomics. 2021;39(6):653-665. doi:10.1007/s40273-021-01019-4
- A socio-ecological framework for mental health and wellbeing. Reupert AE. Advances in Mental Health. 2017;15(2):105-107. doi:10.1080/18387357.2017.1342902