
In a 2026 brain-scan study of mostly teenage patients in China, people with internet gaming disorder had much weaker connectivity between the brain’s first visual processing area and a higher area that recognizes objects. Among the patients, weaker connectivity went with more severe addiction scores.1
Research Highlights
- One visual link stood out: resting-state connectivity between the primary visual cortex (V1) and the lateral occipital complex (LOC) averaged 0.130 in 35 people with gaming disorder vs. 0.364 in 30 healthy controls, a large difference (Cohen’s d = 1.42, corrected p < 0.001).1
- Shorter links differed less: connections between neighboring visual areas were only slightly lower in the gaming disorder group and did not differ significantly between groups.1
- Weaker link, higher addiction score: within the gaming disorder group, lower V1–LOC connectivity correlated with higher Internet Addiction Test scores (r = −0.479; −0.447 after adjusting for age, sex, education, and head motion).1
- Snapshot design: the scans were taken at one point in time, so the study cannot show whether gaming changed these connections or whether the difference came first.1
What Internet Gaming Disorder Is
Internet gaming disorder (IGD) describes gaming that a person can no longer control: it crowds out other activities and continues despite clear harm to school, work, sleep, or relationships. The DSM-5, the American psychiatric diagnostic manual, lists it in Section III as a condition that needs further study before full recognition.2
Most brain research on IGD has focused on reward and self-control circuits. Tian et al. looked somewhere less obvious: the visual system, which has to process every flashing, fast-moving game scene before reward circuits can respond to it.1
The 3 Visual Brain Areas the Study Measured
Vision works in stages. Early areas pick up simple features, and later areas assemble those features into recognizable things. The researchers built a 3-step model of this pathway:1
- Primary visual cortex (V1): the first cortical stop for signals from the eyes, at the back of the head. It encodes basic features such as edges, contrast, and orientation.
- Lingual gyrus: a fold on the underside of the occipital lobe that the researchers treated as a middle processing stage.
- Lateral occipital complex (LOC): a region on the outer side of the back of the brain that responds strongly to whole objects and supports object recognition.3
Functional connectivity measures how closely the activity of 2 brain regions rises and falls together over time. In resting-state fMRI, people lie still in the scanner without doing a task, and regions that are “in sync” are considered functionally connected. Higher values mean tighter coupling.
V1–LOC Connectivity Was Much Weaker in Gaming Disorder
Who was scanned: 35 people diagnosed with IGD by 2 psychiatrists using DSM-5 criteria, and 30 healthy controls, recruited at the First Affiliated Hospital of Zhengzhou University. Ages ranged from 9 to 33, but most participants were teenagers (average age 14.4 in the IGD group and 16.0 in controls), and about 3 in 4 were male in each group.1
What changed: of the 3 connections tested, only the long-range link from V1 to LOC differed clearly between groups. It averaged 0.130 in the IGD group vs. 0.364 in controls (Fisher z values), with an effect size of Cohen’s d = 1.42, which is large.1
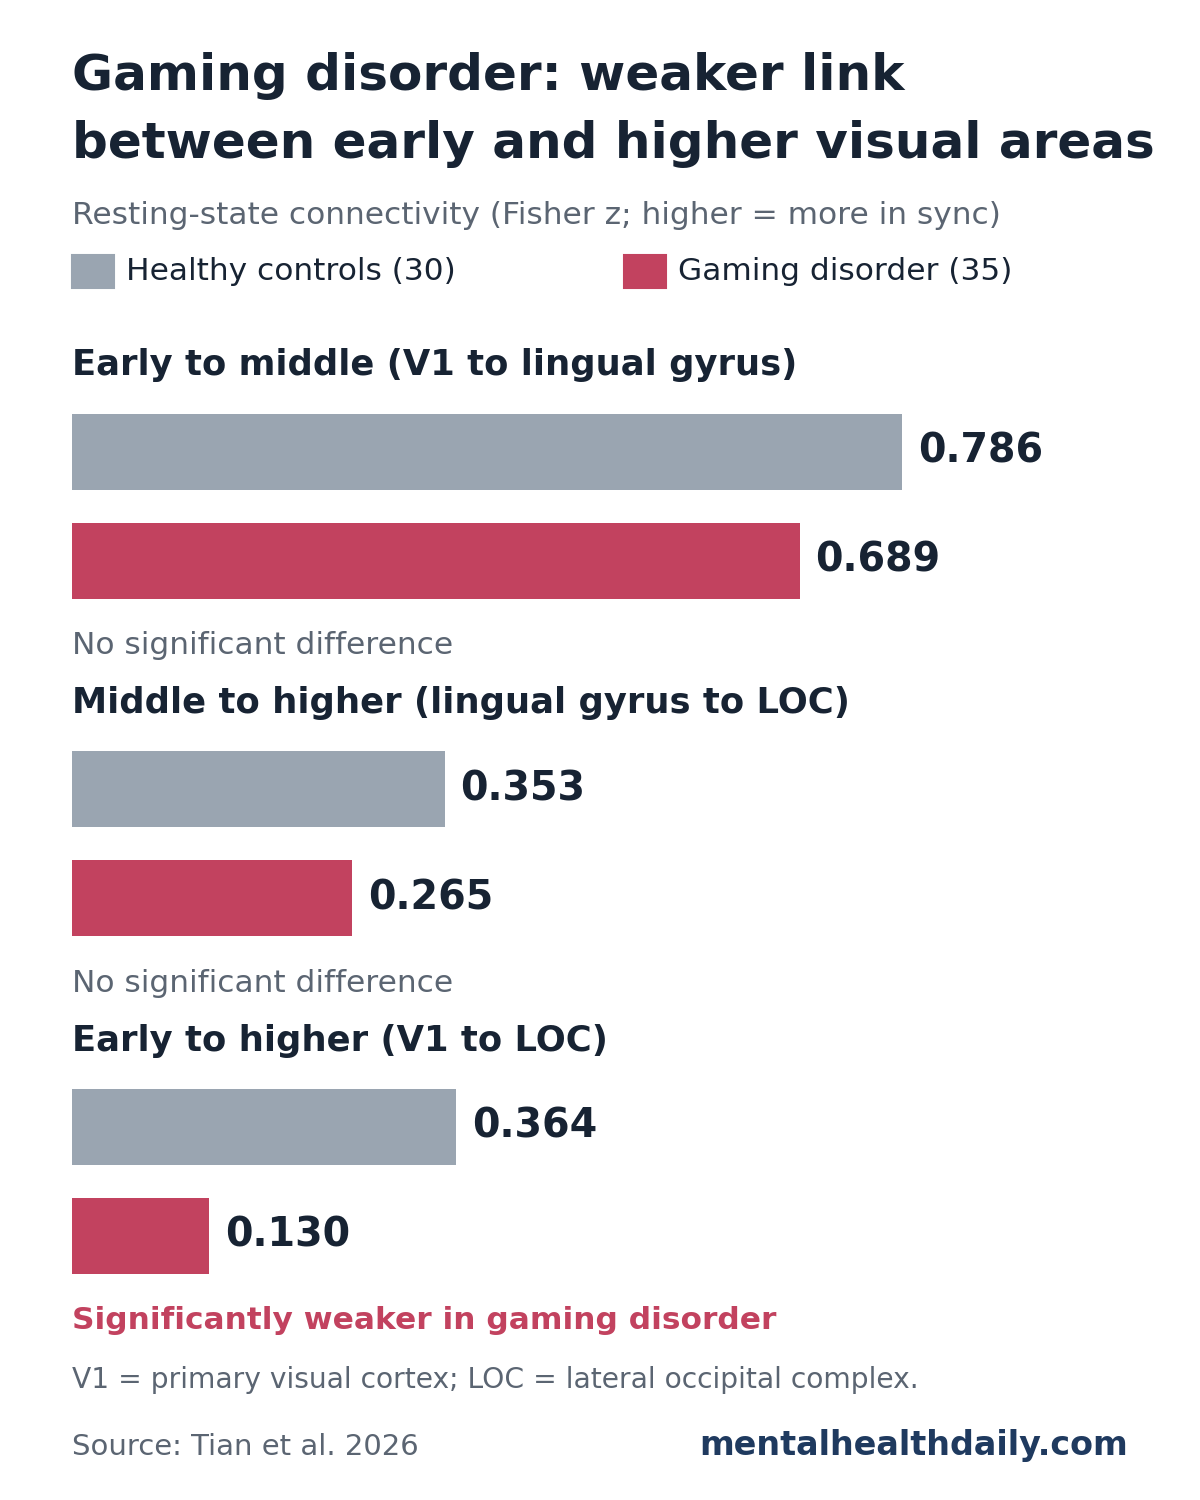
The 2 shorter, step-by-step connections were also somewhat lower in the IGD group:
- V1 to lingual gyrus: 0.689 vs. 0.786 in controls (d = 0.32); nominally significant (p = 0.049) but not after correction for multiple tests
- Lingual gyrus to LOC: 0.265 vs. 0.353 (d = 0.40); not significant
The study could reliably detect only large differences (Cohen’s d of about 0.71 or more), so small-to-moderate drops in these shorter links may have been missed. A combined index comparing long-range with local coupling was also lower in the IGD group, but not significantly (p = 0.062).1
Robustness checks: the V1–LOC difference held after adjusting for age, sex, education, and head motion, and it remained significant when the researchers shrank the brain regions they sampled from 6 mm to 5 mm or 4 mm spheres. None of the adjustment variables was significantly associated with V1–LOC connectivity.1
Weaker V1–LOC Connectivity Went With Higher Addiction Scores
Within the IGD group, the researchers compared connectivity with scores on Young’s Internet Addiction Test (IAT), a 20-item self-report questionnaire. The study required a score of 50 or more for the IGD group, and the group’s average was 63.3.1
- V1–LOC: lower connectivity went with higher IAT scores (r = −0.479, corrected p = 0.016). After adjusting for age, sex, education, and head motion, the correlation was −0.447 (corrected p = 0.048).
- Other measures: neither of the shorter connections nor the combined index correlated significantly with IAT scores.
A correlation of about −0.45 is moderate. It means people with weaker V1–LOC coupling tended to report more severe problems, with plenty of overlap between individuals. With 35 patients, the estimate is also imprecise, and it barely cleared the corrected threshold after adjustment.
Visual Areas and Gaming Cues in Earlier Research
The visual system has turned up before in IGD and other addictions, although usually as a side finding:
- Imaging meta-analysis: a 2022 meta-analysis of 30 task-based fMRI studies (617 people with IGD and 550 controls) reported reduced activity in the lingual gyrus on both sides, alongside changes in frontal and cingulate regions involved in self-control and decision-making.4
- Drug cues light up visual cortex: a 2014 meta-analysis found that 86% of fMRI studies comparing drug pictures with neutral pictures in people with substance dependence reported significant visual cortex activity, with consistent clusters in primary and secondary visual cortex.5
- Gaming pictures draw a stronger brain response: in a 2021 EEG study of 40 people with IGD and 39 controls, the IGD group showed larger late positive potentials, a brain-wave marker of emotional arousal and attention, when viewing game-related pictures.6
The researchers propose that weaker communication between early visual input and object-level areas could change how game scenes are processed, feeding into attention to gaming cues and craving. That idea fits the evidence above, but this study did not test it: participants rested with their eyes closed and never saw game images.1
Limits of This Gaming Disorder Brain-Scan Study
- Cause and effect are unknown. A single scan cannot show whether heavy gaming weakened the V1–LOC link, whether weaker coupling made some young people more vulnerable, or whether something else drives both. The researchers call for long-term studies to sort this out.
- Small, single-center sample. 65 people at one hospital in China, mostly teenage boys. The results need replication in larger and more varied groups.
- Mood symptoms were not matched. The IGD group had substantial anxiety and depression scores (average Hamilton depression score 23.7), which were not measured in controls or adjusted for.
- A general internet scale. Severity came from a general internet addiction questionnaire rather than a gaming-specific one.
- A simplified model. 3 small, predefined spots on each side of the brain stand in for a much richer visual network.
- No diagnostic use. The researchers state that the finding does not establish V1–LOC connectivity as a diagnostic biomarker.
Overall, this is a clear, large group difference in one specific visual connection, and it lines up with earlier hints that the visual system is involved in gaming disorder. It adds a sensory piece to models of IGD that have centered on reward and self-control, and it gives later studies a concrete target to test with gaming cues and repeat scans over time.
References
- Tian J, Zhang H, Wang X, et al. Altered long-range visual hierarchical connectivity in internet gaming disorder: reduced V1–LOC connectivity and its association with addiction severity. Frontiers in Psychiatry. 2026;17:1883842. doi:10.3389/fpsyt.2026.1883842
- Petry NM, O’Brien CP. Internet gaming disorder and the DSM-5. Addiction. 2013;108(7):1186–1187. doi:10.1111/add.12162
- Grill-Spector K, Kourtzi Z, Kanwisher N. The lateral occipital complex and its role in object recognition. Vision Research. 2001;41(10–11):1409–1422. doi:10.1016/S0042-6989(01)00073-6
- Niu X, Gao X, Zhang M, et al. Meta-analysis of structural and functional brain alterations in internet gaming disorder. Frontiers in Psychiatry. 2022;13:1029344. doi:10.3389/fpsyt.2022.1029344
- Hanlon CA, Dowdle LT, Naselaris T, Canterberry M, Cortese BM. Visual cortex activation to drug cues: a meta-analysis of functional neuroimaging papers in addiction and substance abuse literature. Drug and Alcohol Dependence. 2014;143:206–212. doi:10.1016/j.drugalcdep.2014.07.028
- Kim BM, Lee J, Choi AR, et al. Event-related brain response to visual cues in individuals with Internet gaming disorder: relevance to attentional bias and decision-making. Translational Psychiatry. 2021;11:258. doi:10.1038/s41398-021-01375-x