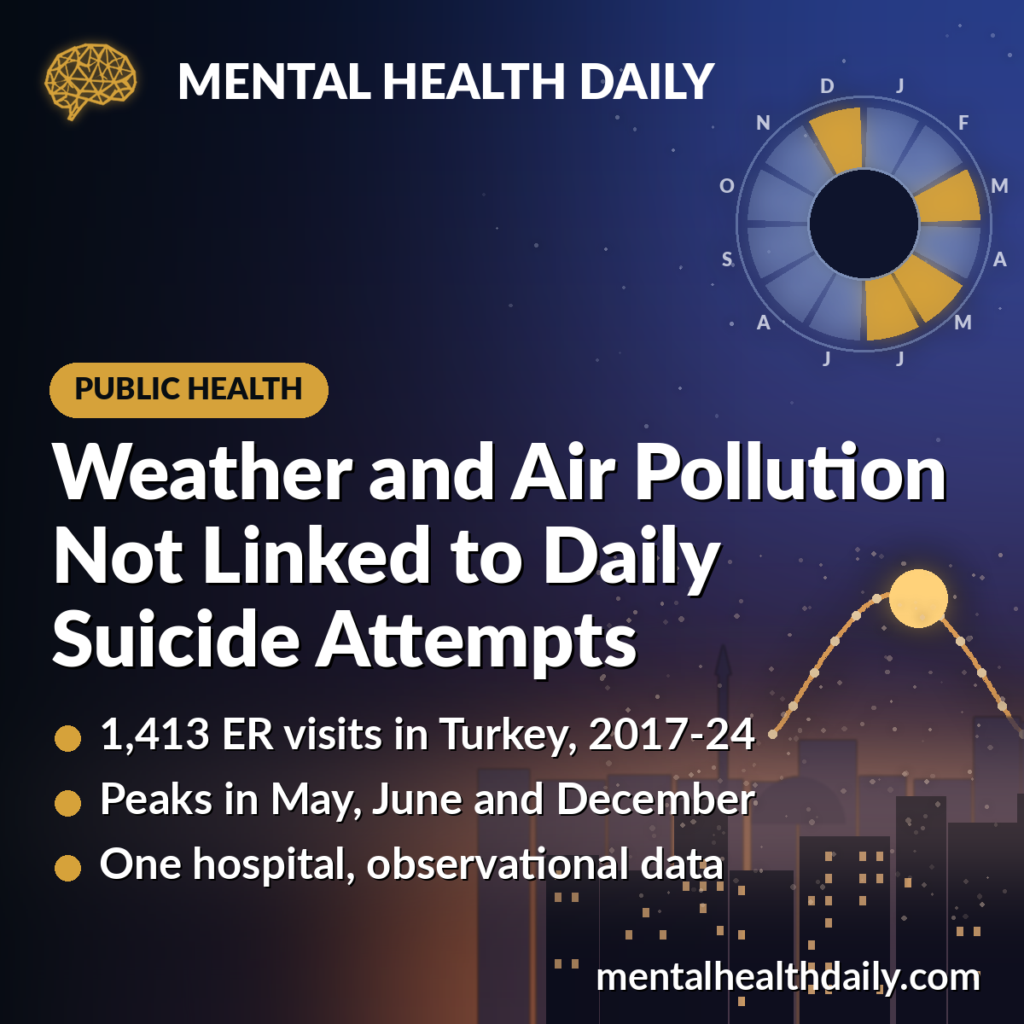
Daily weather and air pollution were not linked to suicide-attempt visits at a hospital in Balikesir, Turkey, according to an 8-year study of 1,413 emergency presentations from 2017 to 2024. Visits did follow a seasonal rhythm, peaking in spring, June and December.1
Research Highlights
- No short-term environmental link: temperature, rainfall, sunlight, fine particles (PM2.5), sulfur dioxide and ozone over the previous 1 to 7 days did not significantly predict daily suicide-attempt visits (all p > 0.05).1
- Seasonal and weekly rhythms: monthly rates were highest in May (4.6 per 100,000), June and December (4.5 each), lowest in January (3.3), and lower on Thursdays than on other weekdays.1
- Mostly young women: the average age was 26.9 years and 64% of visits involved women; 85% of patients were discharged from the emergency department.1
- Rates fell over time: yearly rates peaked at 64.8 per 100,000 in 2019 and were lowest in 2024 at 37.0.1
- Larger studies point the other way: a 341-location temperature study and a meta-analysis of air pollution studies link hotter days and short bursts of air pollution to small increases in suicide deaths.2,3
How the Balikesir Study Tracked Suicide Attempts, Weather and Air Quality
Duygu Kavuncuoglu et al. pulled every emergency presentation coded as intentional self-harm at Balikesir Atatürk City Hospital between January 2017 and December 2024. They kept Balikesir residents only and removed duplicate and incomplete records, leaving 1,413 visits across 2,922 days.1
Balikesir sits in western Turkey with coastlines on the Marmara and Aegean seas, giving it a temperate, transitional climate. For each day, the team matched visit counts with local readings:1
- Weather: mean temperature, total rainfall and hours of sunlight from the state meteorological station in central Balikesir
- Air quality: PM2.5 (fine particles from combustion and traffic), sulfur dioxide (mainly from burning coal and fuel oil) and ozone (formed in sunlight), from the central monitoring station that best matches the hospital’s urban catchment area
This is an ecological time-series study: it compares counts and conditions over time for a whole area, not the exposures or circumstances of individual patients. It can show whether busier days line up with particular conditions. It cannot say why any one person came to the hospital.
Daily Weather and Air Pollution Did Not Predict Suicide-Attempt Visits
To test for short-term effects, the researchers first built a baseline ARMA model (autoregressive moving average). It predicts each day’s count from recent days’ counts and recent prediction errors, so it captures the series’ own slow drifts up and down.1
They then added each environmental variable at lags of 1 to 7 days, plus seasonal indicators for winter, spring and summer. None of them, from heat and sunlight to PM2.5, sulfur dioxide and ozone, significantly improved the prediction of daily visits.1
What the baseline model shows: the researchers describe the series as having a strong “memory” (an autoregressive coefficient of 0.992). That model still explained only about 1.4% of day-to-day variation (adjusted R² = 0.014), so most daily ups and downs were unpredictable from any of the measured factors.1
Low daily counts: the hospital averaged roughly 1 visit every 2 days. With numbers that small, a modest environmental effect of the size seen in large multi-city studies would be hard to detect.
Suicide-Attempt Visits Peaked in Spring, June and December
Monthly averages traced 2 humps across the year. Rates were highest in late spring and early summer (May 4.6 and June 4.5 per 100,000), rose again in December (4.5), and were lowest in January (3.3) and August (3.5). March was also high at 4.5.1
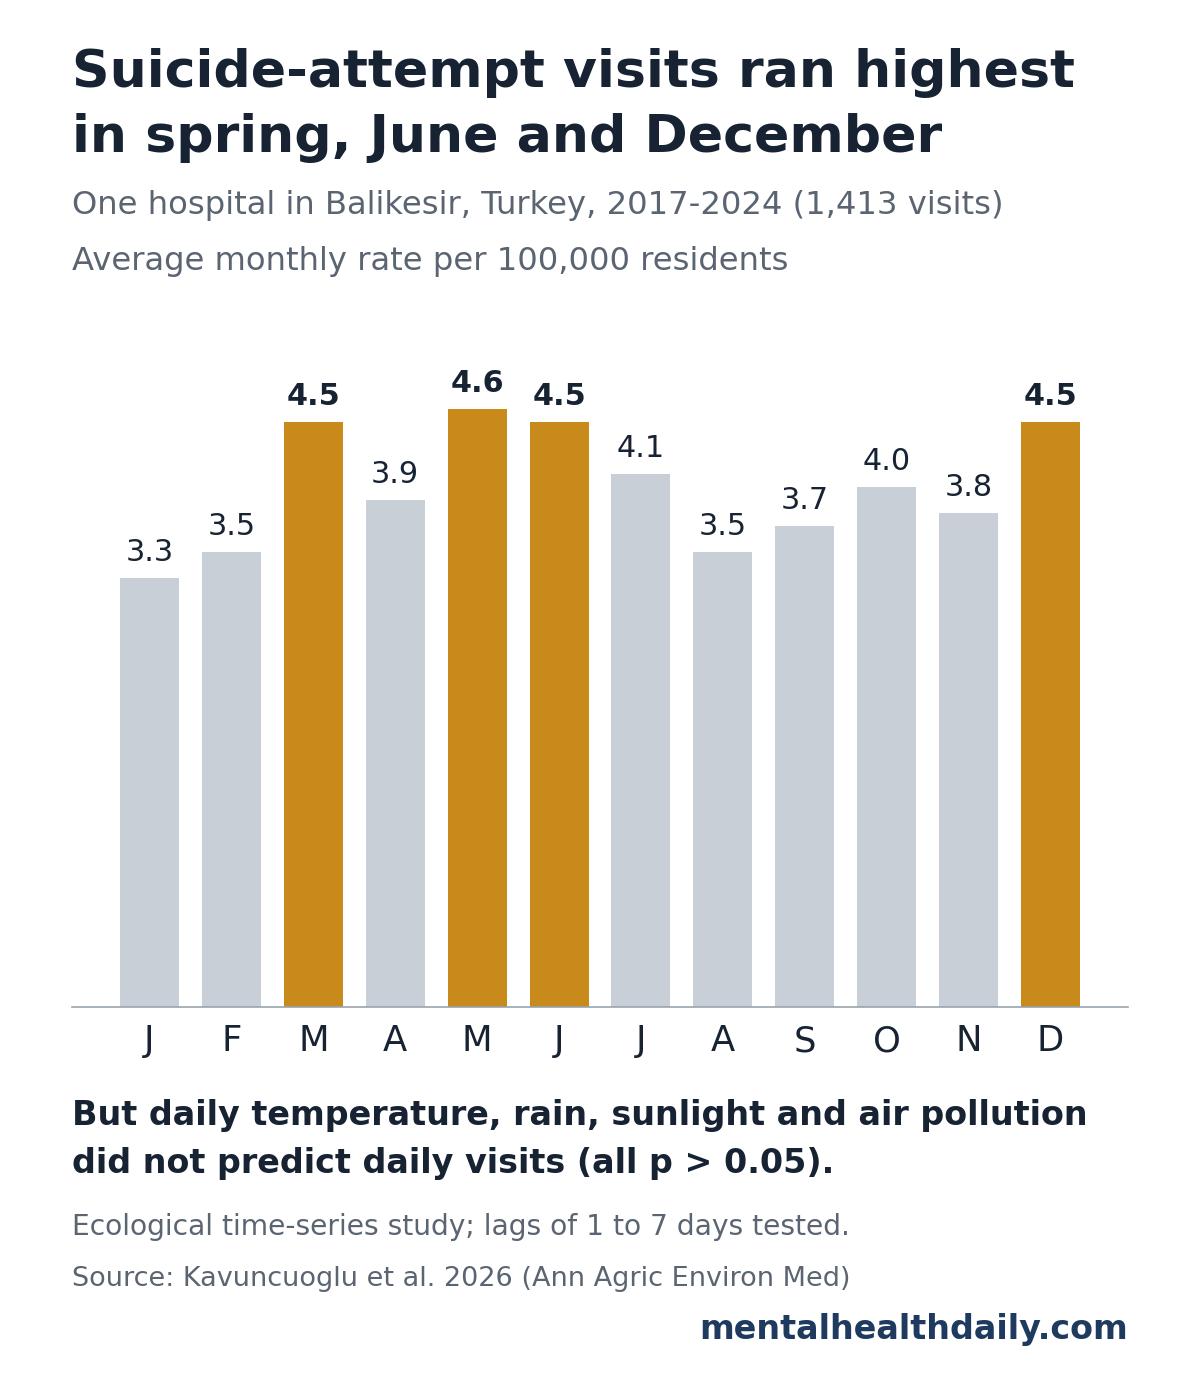
The 2 peaks fell in very different conditions. December had the worst air of the year (PM2.5 averaged 27.4 µg/m³) and the least sunshine (4.0 hours a day). May and June came after winter pollution had cleared, with longer days and warmer weather.1
No single weather or pollution measure fits both peaks. Seasonal indicators were not significant in the time-series model either, and the researchers argue that seasonal swings in suicidal behavior are too complex to come down to simple climate effects.1
Weekly pattern: visits were higher on Wednesdays, Fridays and Saturdays and markedly lower on Thursdays. That differs from the Monday peak often reported elsewhere; the researchers suggest local social routines or weekly patterns in access to care as possible reasons.1
Who Came to the Hospital After a Suicide Attempt
- Age: 26.9 years on average (standard deviation 14.2), consistent with the concentration of suicide attempts among young people worldwide
- Sex: 904 visits (64.0%) involved women and 509 (36.0%) involved men
- Outcome: 85.3% were discharged after emergency care, 12.5% were admitted, 1.0% were referred elsewhere and 1.3% died
Yearly rates moved around but trended down, from a high of 64.8 per 100,000 in 2019 to 37.0 in 2024. For context, Turkey’s official suicide death rate in 2021 was 4.9 per 100,000, and Balikesir’s was 5.7.1
Large Multi-City Studies Link Heat and Air Pollution to Suicide Deaths
The Balikesir result stands out against bigger datasets, which mostly track suicide deaths rather than attempts:
- Temperature: a study of 1,320,148 suicides across 341 locations in 12 countries found that risk generally rose with daily temperature, peaking around 27°C at 1.33 times the risk seen at the coldest temperatures (the 1st percentile). The shape and size of the link varied by country, and the researchers urged cautious interpretation.2
- Air pollution: a 2021 meta-analysis of 11 studies covering 283,550 suicides found small increases in suicide deaths in the days after higher pollution (for example, 1.7% higher odds per 10 µg/m³ of PM2.5 averaged over the same day and the day before). There was no same-day effect. Most of these links were fragile: only sulfur dioxide held up when individual studies were removed, and there were signs of publication bias.3
- Seasons: across 354 communities in 12 countries, suicides usually peaked in spring and dipped in winter, though some countries showed 2 peaks a year, as Balikesir did.4
Those pooled effects are small per day and only emerge with very large numbers. A single hospital with 1,413 visits over 8 years is a much weaker test, so a lack of effect here sits comfortably alongside a small effect in the larger data.
Limitations of the Balikesir Weather and Suicide-Attempt Study
- Ecological design: area-level patterns do not show what any individual experienced.
- One hospital: people who were treated elsewhere or never sought care were missed, and the data count visits, not distinct people.
- One monitoring station: the central station is a reasonable stand-in for the city but cannot capture conditions across the whole province.
- Short-term focus: the model tested day-to-day effects over a week. It could miss cumulative exposure over months, heat waves or other extreme events, and non-linear effects.
- Missing factors: humidity, daily temperature range and personal, social and economic factors were not included.
What This Means for Weather, Pollution and Suicide Prevention
Daily weather is a weak predictor at the local level. In this Turkish city, knowing the temperature, sunlight or pollution level over the past week did not help predict how many people would come to the hospital after a suicide attempt. The researchers conclude that environmental influences, where they exist, more likely work slowly or indirectly than as day-to-day triggers.1
Seasonal and weekly rhythms are still useful for planning. Emergency and crisis services can use local peaks, such as late spring and December in Balikesir, to plan staffing and outreach, while recognizing that these patterns describe populations, not individual risk.
Prevention still centers on people, not forecasts. Recognizing distress, reducing barriers to care and following up after an attempt remain the core of suicide prevention.
If you or someone you know is struggling, help is available. In the United States, call or text 988 to reach the 988 Suicide & Crisis Lifeline. Elsewhere, contact local emergency services or a local crisis line.
References
- Kavuncuoglu D, Betos Koçak M, Yılmaz S, Koçak AO. The role of climatic factors and air quality on the temporal patterns of suicide attempts in Balıkesir, Turkey (2017–2024). Annals of Agricultural and Environmental Medicine. 2026;33(3):333–338. doi:10.26444/aaem/224331
- Kim Y, Kim H, Gasparrini A, et al. Suicide and ambient temperature: a multi-country multi-city study. Environmental Health Perspectives. 2019;127(11):117007. doi:10.1289/EHP4898
- Davoudi M, Barjasteh-Askari F, Amini H, et al. Association of suicide with short-term exposure to air pollution at different lag times: a systematic review and meta-analysis. Science of the Total Environment. 2021;771:144882. doi:10.1016/j.scitotenv.2020.144882
- Yu J, Yang D, Kim Y, et al. Seasonality of suicide: a multi-country multi-community observational study. Epidemiology and Psychiatric Sciences. 2020;29:e163. doi:10.1017/S2045796020000748