
In a 2026 study involving 159 adults in a depressive episode at a Paris hospital, sleep questionnaires, a wrist activity tracker and one night in a sleep lab helped tell bipolar depression apart from unipolar depression.1 The combined model worked well in its own small sample but has not been tested on new patients.
Research Highlights
- Six sleep measures separated the two groups: a combined model reached an AUC of 0.926, correctly flagging 88.2% of bipolar cases and 89.5% of unipolar cases among the 36 patients who had every test.1
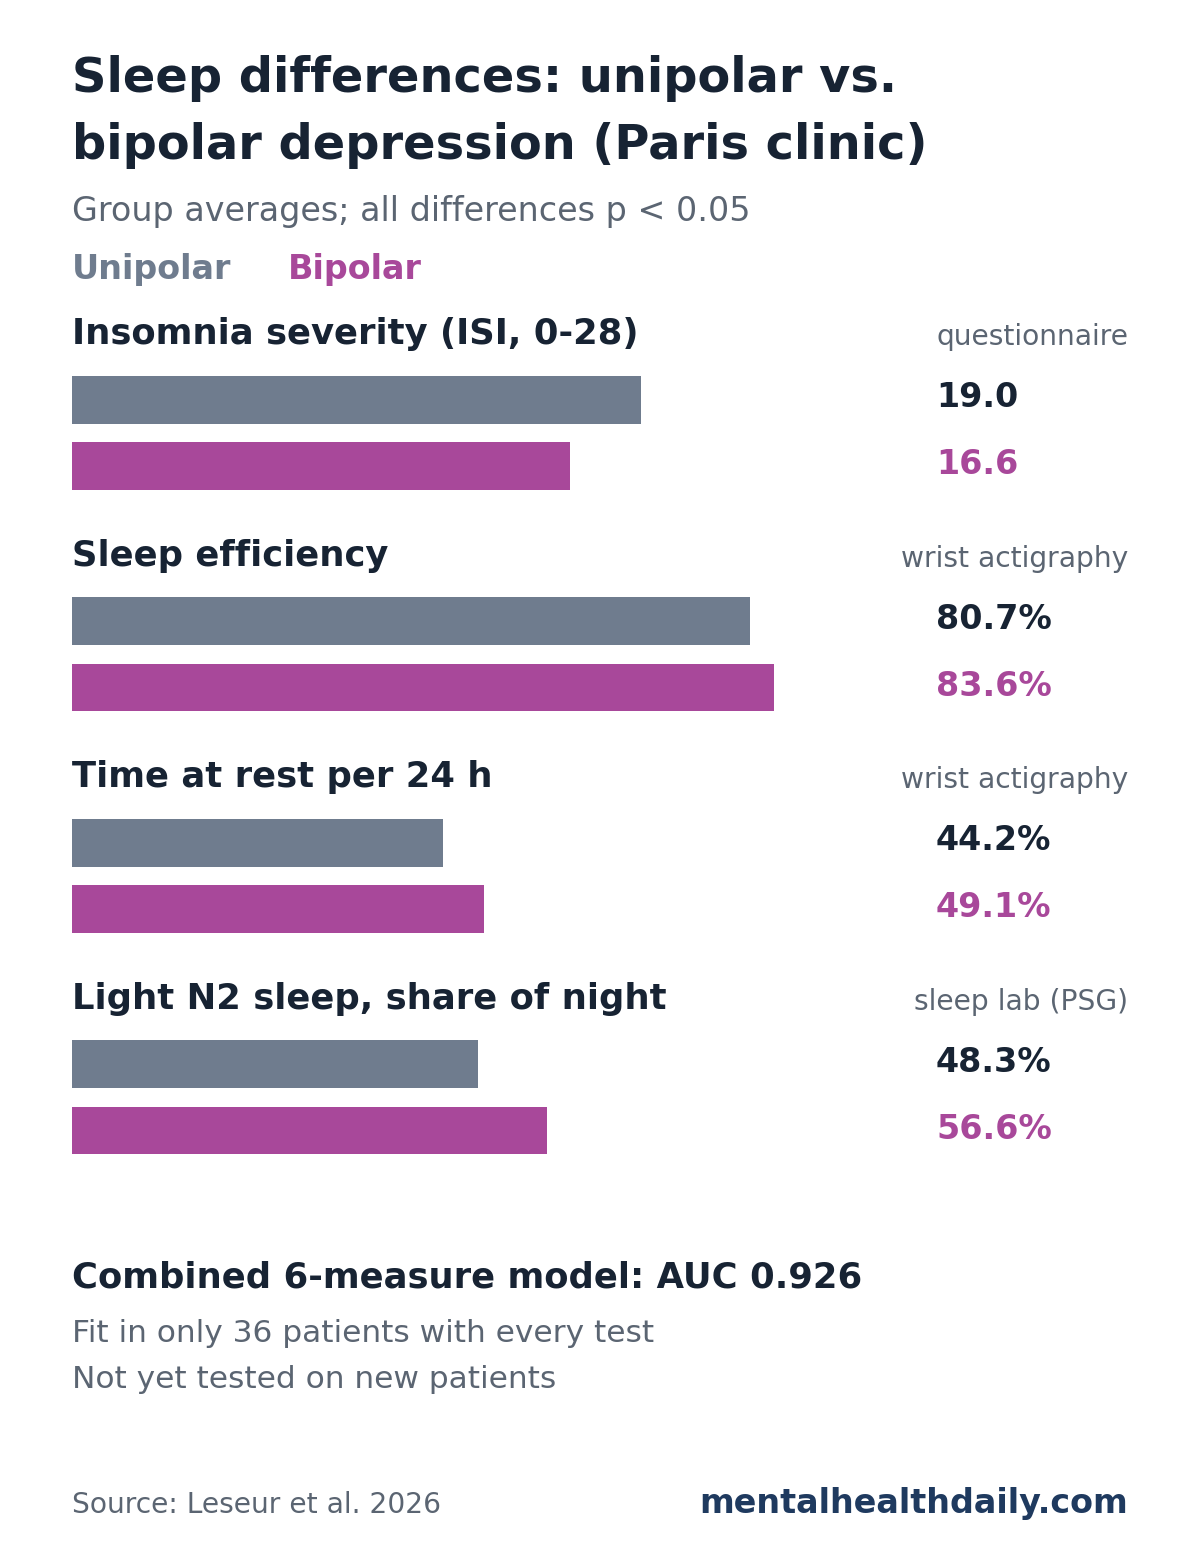
- Unipolar depression meant more insomnia: insomnia severity averaged 18.98 vs. 16.60, and wrist-measured sleep efficiency was lower (80.70% vs. 83.62%).1
- Bipolar depression meant more rest and less movement: patients spent 49.10% of each 24 hours at rest vs. 44.15%, moved less overall and spent more of the night in light N2 sleep (56.56% vs. 48.30%).1
- No outside validation yet: the model was built and scored on the same 36 people, so its accuracy is likely overstated, and no single measure in it was statistically significant on its own.1
Why Bipolar Depression Is Often Mistaken for Unipolar Depression
Unipolar depression (major depressive disorder) involves depressive episodes only. Bipolar depression is a depressive episode in someone with bipolar disorder, who also has periods of mania or hypomania (abnormally elevated, energized mood). The two can look almost identical during the depressive phase.
Bipolar disorder often first shows up as depression, so the correct diagnosis can take 8 to 10 years, according to estimates cited by Leseur et al. That delay matters for treatment: antidepressants prescribed to someone with unrecognized bipolar disorder can worsen the course of illness.1
Sleep is a natural place to look for clues. Doctors have long noticed that oversleeping (hypersomnia) is more common in bipolar depression and insomnia in unipolar depression, but the overlap is large: up to a third of people with bipolar depression report both.1
How the Paris Team Measured Sleep and Daily Activity
Researchers drew patients from routine care at Bichat–Claude Bernard Hospital in Paris between July 2022 and June 2025. All were adults aged 18 to 70 in a major depressive episode, with a psychiatrist’s DSM-5-TR diagnosis of unipolar (116 patients) or bipolar (43 patients) depression.1
The groups were similar in age, sex, body mass index and depression severity. Average scores on the MADRS, a clinician-rated depression scale, were 25.03 in the unipolar group and 24.32 in the bipolar group.1
Patients were assessed in three ways:
- Questionnaires: the Insomnia Severity Index (ISI, 0 to 28), the Pittsburgh Sleep Quality Index (PSQI, where higher scores mean worse sleep), plus scales for hypersomnia, daytime sleepiness and morning-or-evening preference.
- Actigraphy: a watch-like motion sensor worn on the wrist for at least 14 days, which estimates sleep and tracks rest-activity rhythms in daily life. Recordings were available for 135 patients.
- Polysomnography (PSG): one monitored night in a sleep lab that records brain waves, eye movements and muscle activity to score each sleep stage. Only 64 patients had one.
Two actigraphy measures turned out to be important. L5 is the average movement during a person’s 5 least active hours, a rough gauge of how still their rest is. M10 is the average movement during their 10 most active hours, a gauge of daytime activity.
Unipolar Depression Came With More Insomnia and Worse Sleep Quality
People with unipolar depression rated their sleep as worse on nearly every questionnaire measure:1
- Overall sleep quality: PSQI 12.83 vs. 10.61 in bipolar depression (p = 0.001)
- Insomnia severity: ISI 18.98 vs. 16.60 (p = 0.026)
- Taking longer to fall asleep and more sleep disturbance on the PSQI subscores
The wrist trackers backed this up. Sleep efficiency, the share of time in bed actually spent asleep, was 80.70% in unipolar depression vs. 83.62% in bipolar depression (p = 0.026).1
Daytime sleepiness, hypersomnia scores and morning-or-evening preference did not differ between groups.
Bipolar Depression Showed More Rest, Less Movement and More Light Sleep
On actigraphy, people with bipolar depression spent more of each day at rest and moved less, both at night and during their most active hours:1
- Rest over 24 hours: 49.10% vs. 44.15% in unipolar depression (p = 0.017)
- Movement in the quietest 5 hours (L5): 784.52 vs. 1105.48 activity units (p = 0.004)
- Movement in the busiest 10 hours (M10): 10,028 vs. 12,309 activity units (p = 0.024)
In the sleep lab, the difference showed up in sleep stages. N2 is a stage of light non-REM sleep, and N3 is deep, slow-wave sleep, the stage most linked to physical and mental recovery.1
- N2 share of the night: 56.56% in bipolar depression vs. 48.30% in unipolar depression (p = 0.005)
- N3 share of the night: 19.38% vs. 25.64% (p = 0.029)
- Total non-REM sleep: about 5 hours 50 minutes vs. 5 hours (p = 0.013)
People with bipolar depression also trended toward longer total sleep in the lab (about 7 hours 35 minutes vs. 6 hours 36 minutes, p = 0.060). REM sleep and the timing of daily rhythms, such as when the quietest hours began, did not differ.1
Leseur et al. read the pattern as two profiles: a more “activated” unipolar depression with insomnia and restless nights, and a slowed-down bipolar depression with long, light, less restorative sleep. That fits older clinical descriptions of psychomotor slowing in bipolar depression.1
How Well the Combined Sleep Model Separated Bipolar and Unipolar Depression
The team entered every measure that differed between groups into a backward stepwise logistic regression, a method that starts with all candidate variables and drops the weakest one at a time until the best-fitting set remains. Only 36 patients (19 unipolar, 17 bipolar) had every questionnaire, actigraphy and sleep-lab result needed for this step.1
The final model kept six measures:
- Pointing toward unipolar depression: higher ISI, higher PSQI and lower sleep efficiency on actigraphy
- Pointing toward bipolar depression: more rest per 24 hours, less movement in the quietest 5 hours and a higher N2 share of sleep
AUC (area under the curve) measures how well a model ranks one group above the other: 0.5 is a coin flip and 1.0 is perfect. This model scored 0.926, with 88.2% sensitivity (bipolar patients correctly flagged) and 89.5% specificity (unipolar patients correctly flagged).1
Its positive and negative predictive values were 88.3% and 89.5%, and the six measures together explained 49.4% of the variation in diagnosis (McFadden’s R², a goodness-of-fit measure for this kind of model).1
No single measure carried the model. Within the final model, none of the six reached p < 0.05; N2 share came closest (odds ratio 1.182, p = 0.051).1 In a separate post hoc analysis that corrected for multiple comparisons, N2 share was the only significant predictor of bipolar depression (odds ratio 1.193 per percentage point, p = 0.017).1
Limitations: A Small Sample and No Testing on New Patients
This was a single-clinic comparison of people whose diagnosis was already known, which is a reasonable first step for building a model. Several features of the design mean the 0.926 figure is likely higher than the model would achieve in practice:
- Scored on its own data: the measures were chosen and the model was fit and evaluated on the same 36 patients, with no cross-validation or separate test group. Models built this way usually lose accuracy on new people.
- Too few patients for six predictors: the researchers’ own planning rule called for at least 20 patients per variable, which would mean about 120 for six measures.
- Medication: mood stabilizers are first-line treatment for bipolar depression and antidepressants for unipolar depression, and both drug types change sleep stages and daily rhythms. Because drug type tracked diagnosis so closely, the model could not adjust for it.
- Incomplete testing: only 64 of 159 patients had a sleep-lab night, largely because of missed appointments, technical issues and limited lab access.
- Known diagnoses: the hard clinical case is a first depressive episode in someone whose bipolar disorder has not shown itself yet, and this study did not test that situation.
Sleep as a Clue in Bipolar Depression Screening
The group differences match earlier work. A 2025 meta-analysis from the same department found that people with unipolar depression had shorter total sleep and lower sleep efficiency on objective tests than people with bipolar depression, with no differences in REM measures.2
A 2022 meta-analysis of 34 actigraphy studies found that depressed patients with either diagnosis moved less than healthy controls. Lower activity persisted in bipolar disorder after mood recovered, while the gap was much smaller for unipolar patients in remission.3
For now, the practical message is modest: long, heavy sleep and slowed-down days during depression are worth mentioning to a clinician, especially alongside any past periods of unusually high energy or little need for sleep.
Diagnosis still rests on that history, and a sleep-based model would need to work in a new group of patients before it could guide treatment.
References
- Leseur J, Geoffroy PA, Perozziello A, et al. A sleep and circadian biomarker-based predictive model for differentiating unipolar and bipolar depression. Depression and Anxiety. 2026;2026:5556144. doi:10.1155/da/5556144
- Leseur J, Maruani J, Palagini L, Lejoyeux M, Geoffroy PA. Objective sleep markers to differentiate unipolar and bipolar depression: a systematic review and meta-analysis. Neuroscience and Biobehavioral Reviews. 2025;171:106070. doi:10.1016/j.neubiorev.2025.106070
- Wüthrich F, Nabb CB, Mittal VA, Shankman SA, Walther S. Actigraphically measured psychomotor slowing in depression: systematic review and meta-analysis. Psychological Medicine. 2022;52(7):1208–1221. doi:10.1017/S0033291722000903