
Money trouble, loneliness, recent stress, and feeling low or worn out tend to show up together. A 2026 UK Biobank study rolled 18 of these factors into one score and followed 336,922 middle-aged adults for a median of 13.6 years. People in the worst-scoring third were diagnosed with depression at more than 4 times the rate of those in the best-scoring third (adjusted hazard ratio 4.36).1
The gradient is strong and consistent. What it means is less simple: the score counts current symptoms like low mood and tiredness, so part of what it picks up is depression that was already starting.
Research Highlights
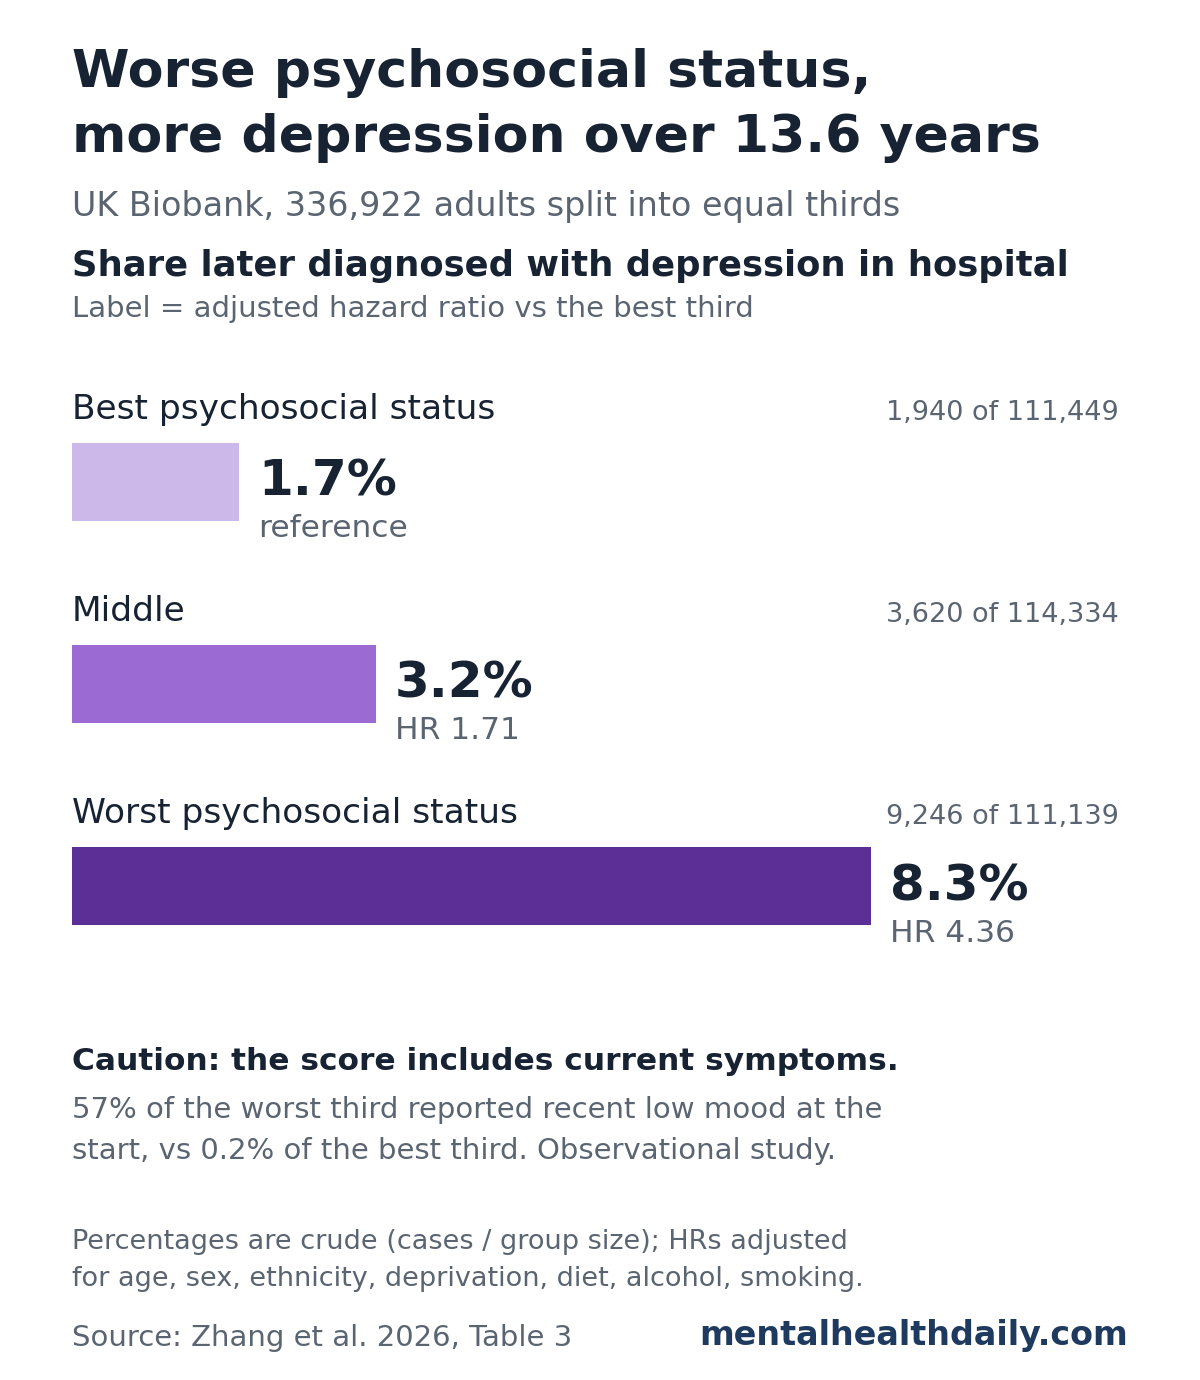
- Over 4 times the risk in the worst third: compared with people in the best psychosocial third, the adjusted hazard ratio for a later depression diagnosis was 4.36 (95% CI 4.15–4.58) in the worst third and 1.71 (1.62–1.81) in the middle third.1
- Steady climb along the score: each 1-point rise on the 0–10 score came with 42% higher risk (HR 1.42).1
- Strongest single factors: low household income (HR 3.82), recent depressed mood (3.09), and loneliness (2.46), with financial difficulties the top stressful event (1.96).1
- Symptoms are built into the score: 57% of the worst third reported recent depressed mood at the start, vs 0.18% of the best third.1
- Observational design: no intervention was tested, and UK Biobank volunteers are healthier and less deprived than the UK population.1,2
How the Psychosocial Score Was Built
Researchers in Hangzhou, China, used baseline questionnaires that UK Biobank participants filled in between 2006 and 2010. Everyone with a history of depression at the start was excluded. The score covered 4 areas:1
- Stressful events in the past 2 years: a trauma to yourself or a close relative, death of a relative or partner, marital separation, and financial difficulties.
- Symptoms in the past 2 weeks: feeling depressed, unenthusiastic, tense, or tired on at least several days.
- Social contact: living alone, rare visits with friends or family, no leisure or social activities, loneliness, and having no one to confide in.
- Socioeconomic status: years of education, household income (from under £18,000 to over £100,000 a year), and employment.
Each factor was weighted by how strongly it predicted depression on its own, then the weighted total was rescaled to run from 0 to 10, with higher scores meaning worse psychosocial status. Participants were split into equal thirds. The weights came from the same data the score was then tested on, and the score has not been checked in a separate cohort.
Depression was counted when it first appeared in hospital inpatient records (ICD-10 codes F32 or F33), through 2022. The analysis adjusted for age, sex, ethnicity, diet, alcohol, smoking, and the Townsend deprivation index, an area-level measure of unemployment, car and home ownership, and overcrowding.1
Worst Psychosocial Third Had Over 4 Times the Depression Rate
Over a median 13.6 years of follow-up, 14,806 participants (4.4%) were diagnosed with depression. The raw numbers by group:1
- Best third: 1,940 of 111,449 (1.7%)
- Middle third: 3,620 of 114,334 (3.2%)
- Worst third: 9,246 of 111,139 (8.3%)
A hazard ratio compares how often something happens in one group vs another at any point during follow-up. An HR of 4.36 means people in the worst third were diagnosed at about 4.4 times the rate of people in the best third, after the adjustments listed above. With only age and sex taken into account, the figure was 4.82, so diet, alcohol, smoking, ethnicity, and deprivation explained only a small part of the gap.1
Risk rose across the whole score rather than only at the extremes, with a steeper climb around 5 to 6 points. The link held in every subgroup tested. It was slightly stronger in men (HR 1.43 per point) than in women (1.41), and stronger in people who had never smoked (1.45) than in current smokers (1.36).1
Low Income, Low Mood and Loneliness Stood Out
All 18 factors were linked to later depression on their own. The strongest in each area:1
- Income: household income under £18,000 vs over £100,000, HR 3.82 (3.43–4.26). Unemployment carried an HR of 1.96.
- Symptoms: recent depressed mood, HR 3.09; lack of enthusiasm, 2.77; tenseness, 2.50; tiredness, 2.24.
- Social contact: loneliness, HR 2.46 (2.37–2.54). Living alone (1.24) and rare visits with friends or family (1.15) mattered much less.
- Stressful events: financial difficulties, HR 1.96, and a trauma to yourself, 1.81. The death of a close relative had the weakest link of any factor (1.11).
The contrast between loneliness and living alone is worth noticing. Feeling lonely was a much stronger predictor than the plain fact of living by yourself.
Why Part of the Signal Is Early Depression
The worst-scoring third was defined partly by how people already felt. At the start, 57% of that group reported feeling depressed on at least several days in the past 2 weeks, and 84% reported tiredness. In the best third, those figures were 0.18% and 12%. Loneliness followed the same pattern: 40% in the worst third vs 0.4% in the best.1
So the score mixes life circumstances with symptoms that often come before a depression diagnosis. The 4.36 hazard ratio reflects both. The authors ran a check that dropped anyone diagnosed in the first 2 years and report that results were largely unchanged, which argues against the whole effect being depression that was already underway. Two years is a short window for a condition that can simmer for a long time before it reaches a hospital record, though.
The paper also estimates population attributable fractions, the share of cases that would be prevented if a factor were removed entirely, assuming it causes depression. Tiredness came out highest at 38%, loneliness at 18%, and low income at 13%.1 These are best treated as a ranking of how common and how strongly linked each factor is. Tiredness topping the list fits the idea that the numbers partly track early illness. Several income and education estimates also came out negative even though every one of those groups had higher risk, a sign of how fragile these calculations are.
Limitations
- Observational. The authors state that the associations do not prove causation. Unmeasured factors such as physical illness, earlier mental health problems, or genetics could account for part of the gap.
- A selective cohort. Only 5.5% of the 9.2 million people invited joined UK Biobank. Participants were less deprived, smoked less, and had fewer health conditions than the general population.2 This study also dropped 118,041 people with missing psychosocial answers. The authors call the sample “nationally representative” in one place but list its healthier, mostly White makeup as a limitation.
- Hospital diagnoses only. Depression treated only by a family doctor was not counted, so the study mostly captures depression serious or complicated enough to reach hospital records.
- One snapshot. Psychosocial status was measured once, by self-report, and was not updated over more than a decade.
- No external test of the score. The weights and the results come from the same dataset.
How This Fits With Other Cohort Studies
The result is consistent with earlier cohort studies, and the combined risk here is larger.
- 24 countries, older adults: in 69,160 people aged 50 and older from 5 cohorts, low socioeconomic status combined with social inactivity and loneliness was linked to 2.45 times the risk of depression (measured with symptom scales) vs high status, active and not lonely. Social activity and loneliness each explained only about 6% of the link between socioeconomic status and depression.3
- Loneliness in England: in the English Longitudinal Study of Ageing, loneliness predicted higher depressive symptoms over 12 years even after adjusting for social isolation, social support, and genetic risk. The authors estimated that 11% to 18% of depression cases could be prevented if loneliness were eliminated,4 close to the 18% in the UK Biobank study.
The UK Biobank hazard ratio of 4.36 is larger than the 2.45 from the multi-country study. One likely reason: the UK Biobank score includes current symptoms, while the multi-country study excluded people with depressive symptoms at the start.
What It Means
The authors argue that addressing stress, social contact, and money together would prevent more depression than tackling any one of them. That is a reasonable next question, but this study did not test any intervention, so it cannot say how much a combined program would help.
What the study does show well is who is at higher risk. A short questionnaire covering recent stress, low mood, loneliness, and income picked out a group with roughly 8% hospital-diagnosed depression over 13 years, vs under 2% in the best-off third. For clinicians and public health teams, that is a practical reason to ask about money worries and loneliness alongside mood.
If you are feeling persistently low, lonely, or under financial strain, talking to a doctor is a reasonable step. You do not need a diagnosis to ask for help.
References
- Zhang X, Sang Y, Qiu M, et al. Psychosocial status and long-term risk of depression in middle-aged adults: evidence from a prospective cohort study. Epidemiology and Psychiatric Sciences. 2026;35:e61. doi:10.1017/S2045796026101012
- Fry A, Littlejohns TJ, Sudlow C, et al. Comparison of sociodemographic and health-related characteristics of UK Biobank participants with those of the general population. American Journal of Epidemiology. 2017;186(9):1026–1034. doi:10.1093/aje/kwx246
- Wang Y, Liu M, Yang F, et al. The associations of socioeconomic status, social activities, and loneliness with depressive symptoms in adults aged 50 years and older across 24 countries: findings from five prospective cohort studies. Lancet Healthy Longevity. 2024;5(9):100618. doi:10.1016/j.lanhl.2024.07.001
- Lee SL, Pearce E, Ajnakina O, et al. The association between loneliness and depressive symptoms among adults aged 50 years and older: a 12-year population-based cohort study. Lancet Psychiatry. 2021;8(1):48–57. doi:10.1016/S2215-0366(20)30383-7